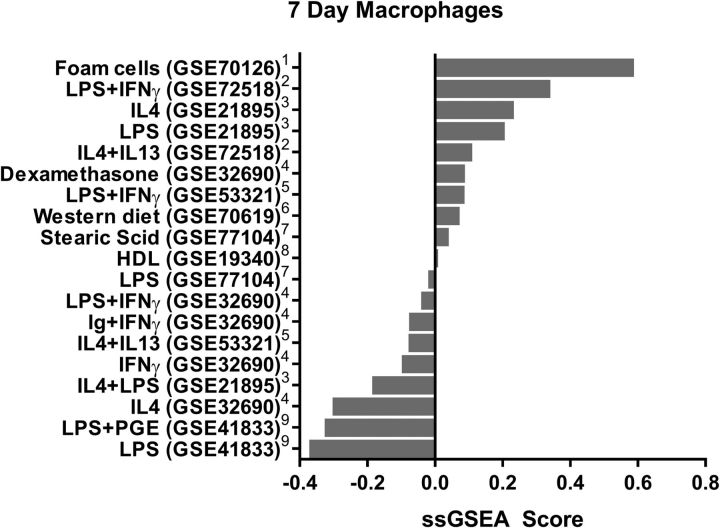
Figure 10.
ssGSEA analysis comparing 7 d macrophages to other macrophage treatment conditions. The 7 d macrophages are most enriched in foam cell genes compared to genes expressed under 18 other macrophage treatment conditions. The foam cell data set here is from Thomas et al. (2015), whereas the data set in Figure 9 is from Spann et al. (2012). 1Thomas et al. (2015); 2Haribhai et al. (2016); 3El Chartouni and Rehli (2010); 4Riquelme et al. (2013); 5Li et al. (2015); 6Goo et al. (2016); 7Robblee et al. (2016); 8Suzuki et al. (2010); 9MacKenzie et al. (2013).

