
Figure 3.
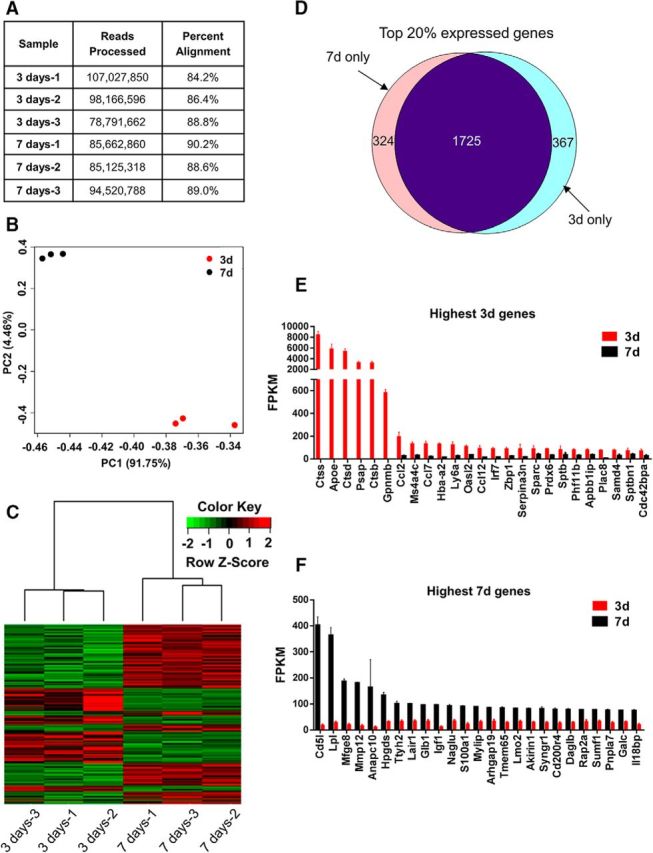
Macrophages at 3 and 7 d after SCI display distinct clustering and different expression of highly enriched genes. A, The 3 d (n = 3) and 7 d (n = 3) samples showed a range of 80–107 million 100 base pair sequence reads with 84–90% alignment. B, C, Both principal component analysis of all genes (B) and hierarchical clustering of differentially expressed genes (C) showed small intragroup differences and distinct separation of the 3 d and 7 d macrophage data sets. D, Venn diagram displaying the number of same or different genes from the top 20% of the highest expressed genes (2416 genes with highest FPKM values) in 3 and 7 d macrophages. From the top 20% expressed genes represented in D, the 25 genes with the highest FPKM values are listed in E and F. n is the number of biological replicates. Error bars indicate SEM.