
Figure 4.
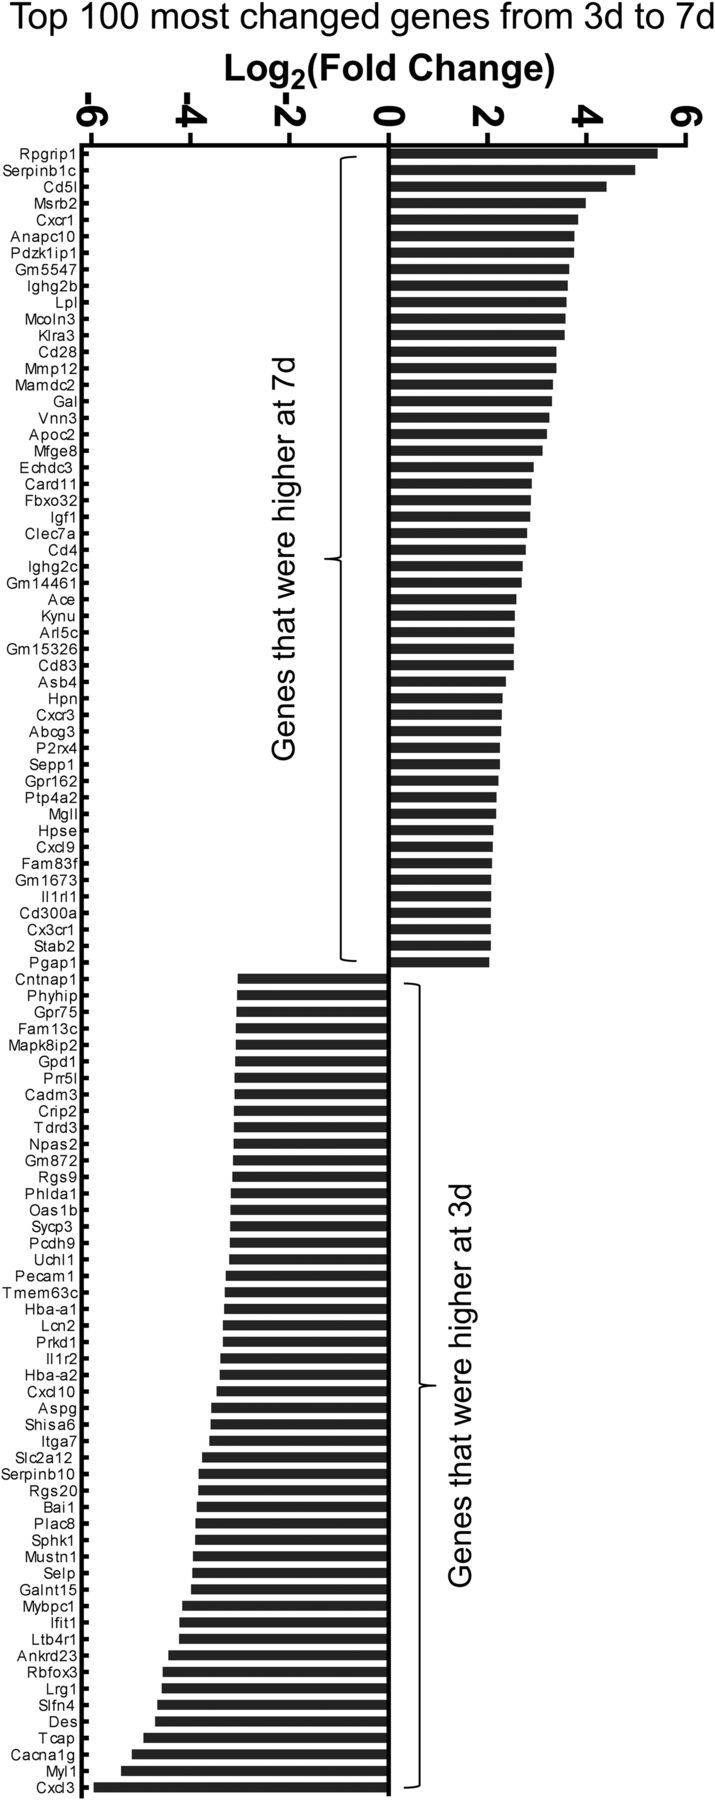
The most differentially expressed genes between macrophages at 3 and 7 d after SCI. A rank order list of 100 genes that were expressed higher in 7 or 3 d macrophages is shown. Note that although ctss, ctsd, ctsb, apoe, psap, and gpnmb are also very highly expressed at 3 d, they are not included in the graph because their differential expression could not be mathematically calculated (results in infinity).