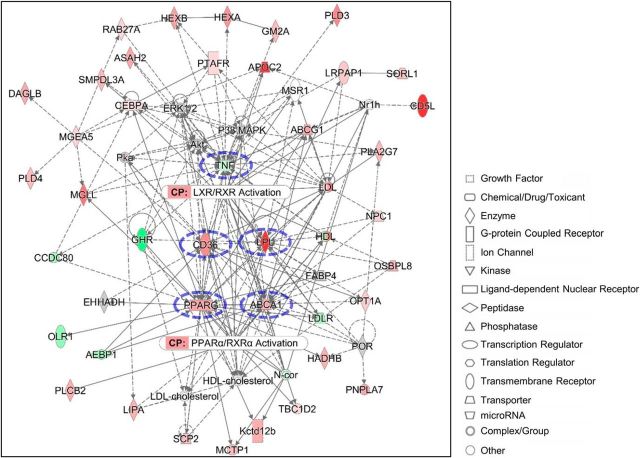
Figure 7.
Pathway analysis identifies canonical lipid metabolism pathways with distinct network hubs. Molecular network generated by ingenuity pathway analysis using 7 d macrophage genes represented in lipid catabolism GO biological processes. Direct interactions are represented by continuous lines, while indirect interactions are represented by dashed lines. The color intensity of a molecule indicates the degree of increased (red) or decreased (green) enrichment of the gene compared to 3 d macrophages. Other colors indicate the presence (gray) or absence (white) of a given gene in the data set. The network forms hubs around cd36, lpl, pparg, abca1, and tnf (blue dotted circles). LXR/RXR and PPARα/RXRα canonical pathways (CPs) are the most highly enriched pathways identified by the network analysis.

