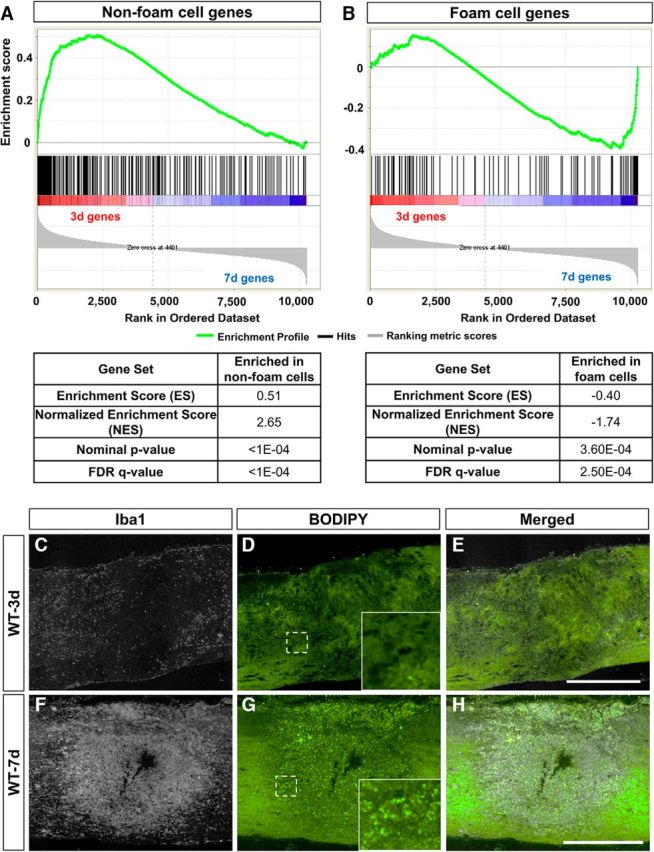
Figure 9.

Foam cell genes are enriched in 7 d macrophages. GSEA comparing all genes in our data set to previously published data set on non-foam cells (614 genes) and foam cells (210 genes; Spann et al., 2012) is shown. A–H, Non–foam cell genes were overrepresented in our 3 d macrophages (A), while foam cell genes were overrepresented in our 7 d macrophages (B). This was consistent with the absence of macrophage (Iba1) lipid droplets (BODIPY; green) at 3 d (C–E; n = 7) and their presence at 7 d after SCI (F–H; n = 7). Each black vertical line in A and B represents a macrophage gene in our data set and shows a gene's relative location in the ranking list generated according to FPKM values. Statistical tests are shown in Table 1. Insets in D and G are magnified images of dotted regions. Bright green dots are lipid droplets stained by BODIPY. Scale bars: 500 μm. n indicates the number of biological replicates.
