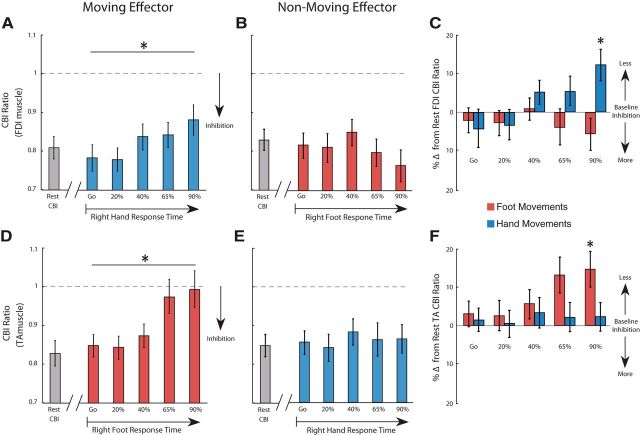
Figure 5.
CBImove. A, B, The x-axis represents CBImove for the right FDI in preparation to moving the hand (A) and foot (B). FDI CBImove measured at five timings (T1–T5) with respect to individual mean response times separately for the hand (blue) and foot (red). *CBI was reduced significantly only in preparation of hand movements. C, CBImove was calculated as the percentage difference from FDI CBI obtained at rest. D, E, The x-axis represents CBImove for the right TA in preparation to moving the foot (D) and hand (E). F, Percentage difference from TA CBI obtained at rest. Positive values indicate disinhibition and negative values increased inhibition. *Only hand movements at 90% RT (T5) modulated CBImove. Data are shown as mean ± SEM.

