
Figure 1.
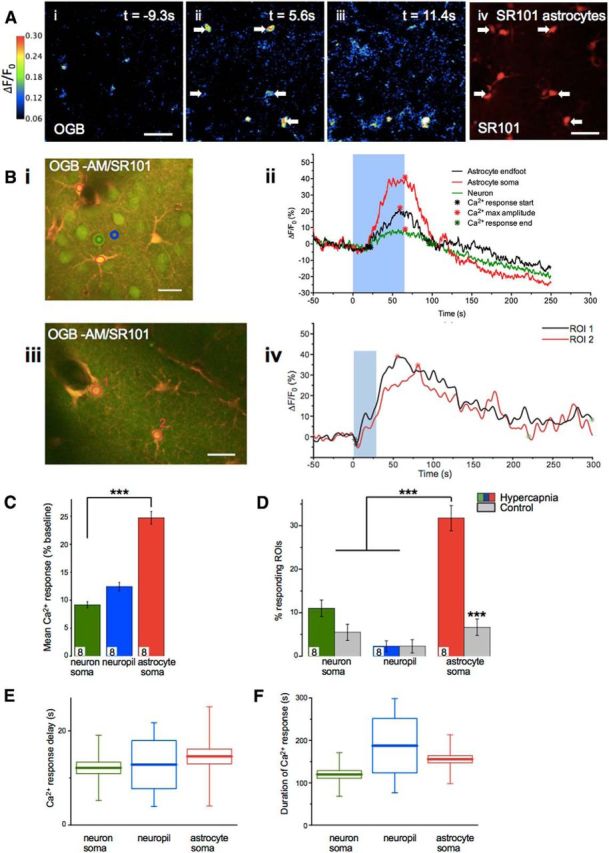
Astrocyte [Ca2+]i transients are evoked by CO2 in vivo. A, Example still images of mouse cortical layer II/III from 2PLSM. OGB is used as a calcium indicator (Ai–Aiii) and sulforhodamine 101 (SR101, Aiv, average image for whole recording) is used to stain astrocytes. Color scale refers to images Ai–Aiii. White arrows indicate astrocytes that show a Ca2+ response to CO2 of at least twice its baseline Ca2+ fluctuation. In this case, CO2 stimulus begins at t = 0 s and is applied for 36 s. Aiii, Recovery of immediate CO2 induced Ca2+ transient. Scale bars, 40 μm. Bi, Biii, Further example images of mouse cortical layer II/III from 2PLSM showing example ROI placement. Merge images showing OGB and SR101 (Bi, Biii). Red ROI1 indicates astrocyte endfoot. Red RO12 indicates astrocyte soma (layer II: n = 181, 8 mice). Green ROI indicates neuron soma (layer II: n = 153, 8 mice). Blue ROI indicates neuropil (layer II: n = 104, 8 mice). Scale bar, 20 μm. Example time series (Bii, Biv) of [Ca2+]i response in astrocyte and neuron soma ROIs (as indicated in Bi, Biii). Blue box represents time during which expired CO2 level is increased. C, Mean Ca2+ response in ROIs. Colors represent ROIs located as shown in Bi. D, Percentage of ROIs for each cell type that showed a Ca2+ response with and without a hypercapnia stimulus. For no hypercapnia (control), n = 170 astrocyte somas, n = 148 neuronal soma, and n = 96 neuropil ROIs, n = 8 mice. Colors represent description in B. E, Delay from hypercapnia start time to start of Ca2+ response in ROI. F, Duration of Ca2+ response in each ROI in response to CO2 stimulus. E, F, Box plots represent the mean (small square). Edges of the box represent 25% and 75% of data. End lines indicate maximum and minimum values. Data are mean ± SEM. **p < 0.01. ***p < 0.001.