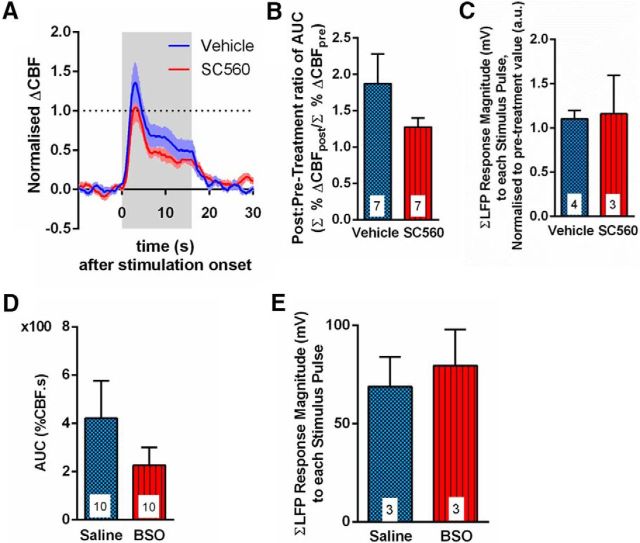
Figure 6.
CBF responses to whisker pad stimulation in vivo are independent of GSH. A, Mean time course of local CBF response to whisker pad stimulation, measured by laser speckle contrast imaging, in vehicle (DMSO)- (blue) and SC560- (red) injected rats. Colored box represents time of stimulation. Dotted black line indicates pretreatment peak of 1. B, Mean AUC of the CBF response to whisker pad stimulation. n = 7 rats for each group. C, Mean neural response (LFP) magnitude to whisker pad stimulus (summed over total 16 s length of stimulus). Responses are normalized to the first pulse response for each rat. n = 4 DMSO-treated rats; n = 3 SC560-treated rats. D, Mean AUC of the whisker pad stimulation-evoked CBF response in saline- (blue) and BSO- (red) injected rats. n = 10 rats for each group. E, Mean neural response (LFP) magnitude to whisker pad stimulation (summed over total 16 s length of stimulus). Responses are normalized to the first pulse response for each rat. n = 3 rats in each group. Data are mean ± SEM.

