Figure 1.
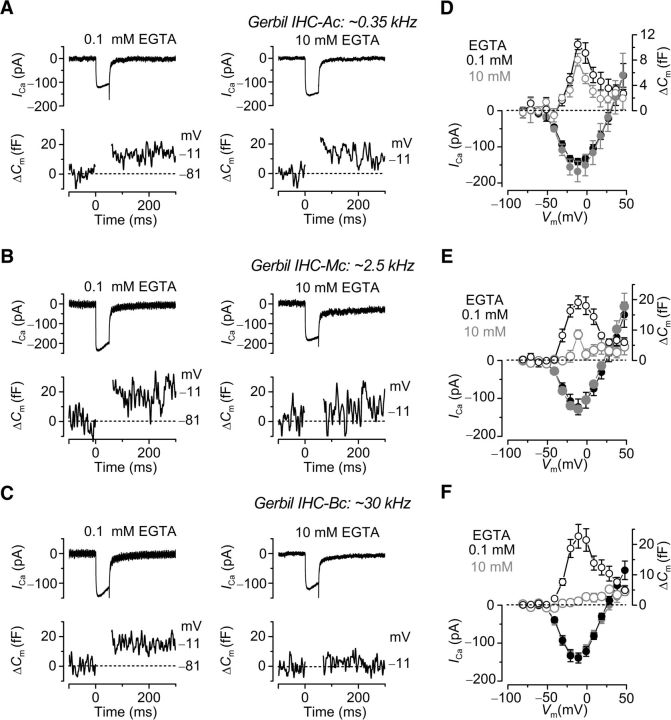
Ca2+ dependence of exocytosis in gerbil IHCs. A–C, ICa and ΔCm from apical (A: ∼0.35 kHz), middle (B: ∼2.5 kHz), and basal (C: ∼30 kHz) IHCs in the presence of 0.1 mM EGTA (left) and 10 mM EGTA (right). Recordings were obtained in response to 50 ms voltage steps from the holding potential of −81 mV to −11 mV. For clarity, only responses at −81 mV and −11 mV are shown. D–F, Average peak I–V and ΔCm–V curves in apical (D: 0.1 mM EGTA, P20–P21, n = 6; 10 mM EGTA, P21–P27, n = 8), middle (E: 0.1 mM EGTA, P23–P24, n = 6; 10 mM EGTA, P23–P24, n = 7), and basal (F: 0.1 mM EGTA, P18–P27, n = 13; 10 mM EGTA, P21–P27, n = 10) IHCs. In this and the following figures, Ac, apical coil; Mc, middle coil; Bc, basal coil.

