Figure 2.
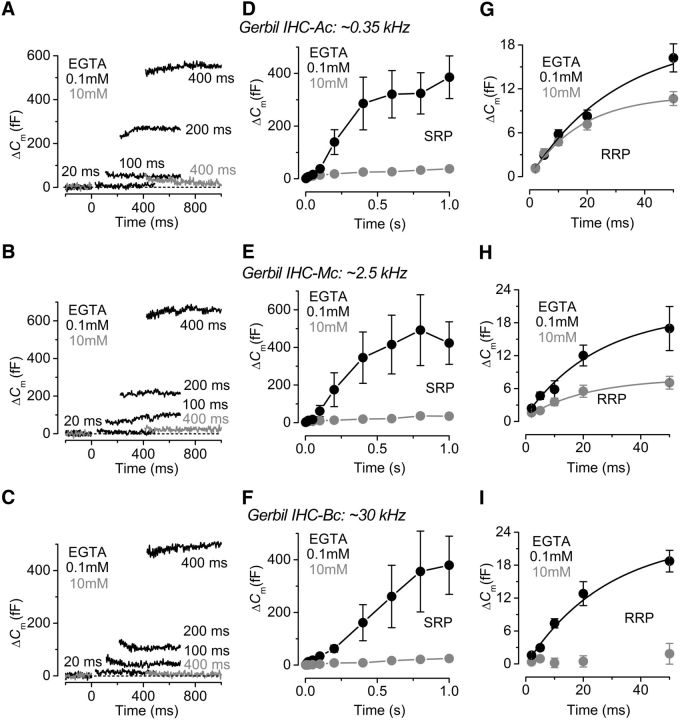
Kinetics of vesicle release in gerbil IHCs. A–C, ΔCm from apical (A), middle (B), and basal (C) IHCs in the presence of 0.1 mM EGTA (black traces) and 10 mM EGTA (gray traces). Recordings were obtained in response to voltage steps from 2 ms to 1.0 s (to ∼−11 mV) that elicit both the RRP and SRP. For clarity, only a few responses are shown. D–F, Average ΔCm obtained using the above protocol from apical (D: 0.1 mM EGTA, n = 8; 10 mM EGTA, n = 5), middle (E: 0.1 mM EGTA, n = 5; 10 mM EGTA, n = 6), and basal (F: 0.1 mM EGTA, P18–P20, n = 6; 10 mM EGTA, P21–P31, n = 11) IHCs revealing the SRP. G–I, Isolated RRP (first 50 ms expanded from D–F) approximated with single exponential functions from the average data: apical (G: 0.1 mM EGTA, maximum ΔCm = 19.2 ± 5.0 fF, τ = 31 ± 12 ms; 10 mM EGTA, ΔCm = 11.1 ± 1.0 fF, τ = 18 ± 3 ms), middle (H: 0.1 mM EGTA, ΔCm = 19.9 ± 5.8 fF, τ = 25 ± 13 ms; 10 mM EGTA, ΔCm = 7.9 ± 1.3 fF, τ = 21 ± 8 ms), and basal (I: 0.1 mM EGTA, ΔCm = 23.1 ± 5.7 fF, τ = 28 ± 12 ms; 10 mM EGTA data could not be fitted because ΔCm was almost absent). Note that the time on the x-axis in D–H indicates the voltage step duration.

