Figure 3.
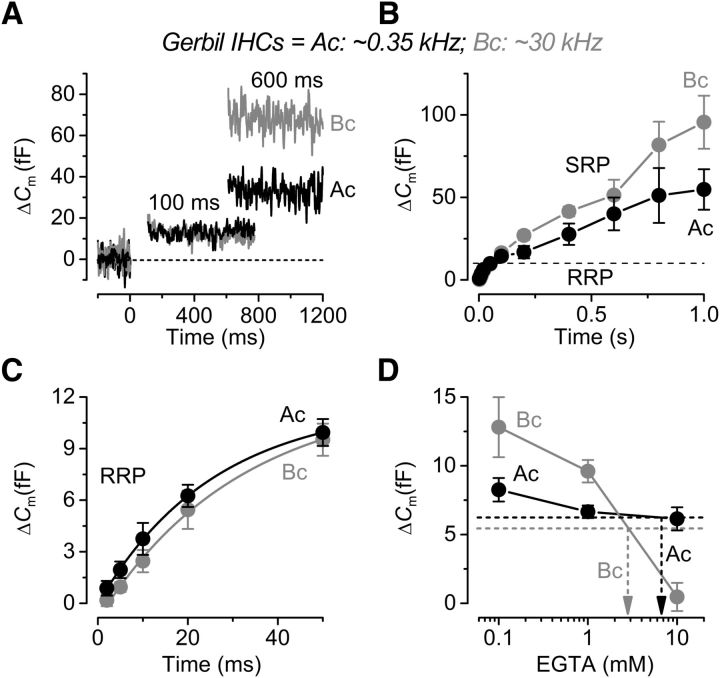
Kinetics of vesicle release in endogenous Ca2+ buffer from gerbil IHCs. A, ΔCm from apical (black) and basal (gray) IHCs recorded with perforated patch. Recordings were obtained as described in Figure 2. For clarity, only a few responses are shown. B, Average ΔCm from apical (P37–P52, n = 4) and basal (P37–P60, n = 5) IHCs revealing the RRP and SRP. C, Isolated RRP (first 50 ms expanded from B) approximated with single exponential functions from the single data (apical, maximum ΔCm = 11.6 ± 1.8 fF, τ = 26 ± 10 ms; basal, ΔCm = 12.2 ± 3.2 fF, τ = 31 ± 17 ms). D, The perforated-patch values of ΔCm at 20 ms, a value that is well within the range of the RRP, were extrapolated (dotted lines) to those obtained using different EGTA concentrations (data from Fig. 2). The 1 mM EGTA data are from Johnson et al. (2008). Note that the time on the x-axis in B and C indicates the voltage step duration.

