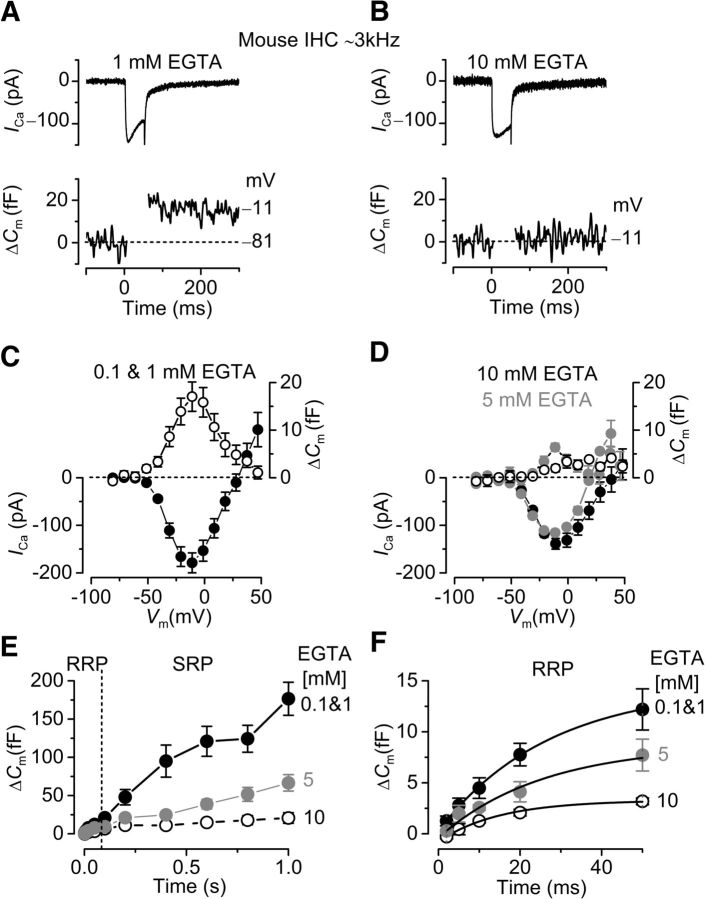
Figure 4.
Ca2+ currents and ΔCm in mouse IHCs. A, B, ICa (top panels) and ΔCm (bottom panels) responses recorded from IHCs positioned in the apical region (CF: ∼3.0 kHz) of the mouse cochlea in the presence of low (0.1 and 1 mM) and high (10 mM) concentrations of intracellular EGTA, respectively. Recordings were obtained in response to 50 ms voltage steps from the holding potential of −81 mV to −11 mV. C, D, Average peak current (I, bottom) and capacitance (ΔCm, top) plotted as a function of membrane potential from IHCs recorded in the presence of low and high intracellular EGTA, respectively. E, Average ΔCm in response to voltage steps from 2 ms to 1.0 s (to ∼−11 mV) showing the RRP and SRP. F, RRP (first 50 ms expanded from E) approximated with single exponential functions for the different concentrations of EGTA used (0.1 and 1 mM: maximum ΔCm = 16.4 ± 3.4 fF, τ = 32 ± 10 ms; 5 mM: ΔCm = 8.2 ± 2.0 fF, τ = 21 ± 4 ms; 10 mM: ΔCm = 3.4 ± 0.4 fF, τ = 17 ± 2 ms). The available RRP was calculated using a conversion factor of 37 aF/vesicle (Lenzi et al., 1999). Note that the time on the x-axis in E and F indicates the voltage step duration.

