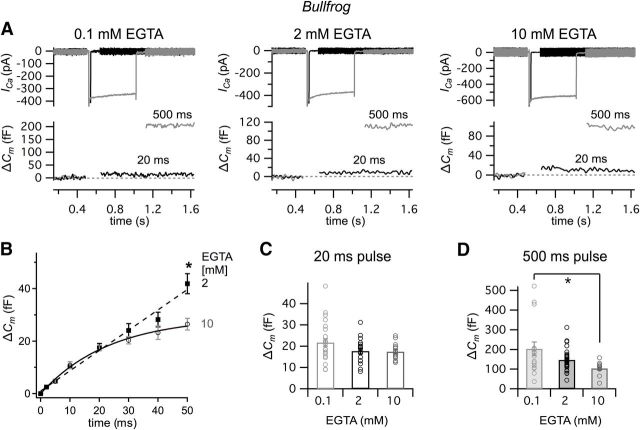
Figure 5.
Ca2+ currents and ΔCm in bullfrog hair cells tuned to ∼ 400–500 Hz sound signals. A, Calcium current (ICa) and membrane capacitance (Cm) were measured while hair cells were depolarized from a holding potential of −90 mV to −30 mV for 20 ms (black) and 500 ms (gray) with 0.1 mM (left), 2 mM (middle), and 10 mM of intracellular EGTA (right). Note the change in vertical scales for the Cm data and the large ΔCm jump (exocytosis) produced by 500 ms depolarizing pulses when 0.1 mM EGTA is used in the patch pipette internal solution. B, Average ΔCm in response to voltage steps from 2 to 50 ms with 2 mM (black) and 10 mM EGTA (gray). The depolarization of 50 ms from −90 mV to −30 mV only showed significant difference of ΔCm between 2 and 10 mM EGTA. *p < 0.05 (unpaired t test). Data modified with permission from Graydon et al. (2011). C, Comparison of ΔCm in response to voltage steps of 20 ms from −90 mV to −30 mV using 0.1 mM (light gray, n = 27, 21.7 ± 1.7 fF), 2 mM (black, n = 18, 17.8 ± 1.4 fF), and 10 mM (gray, n = 14, 17.4 ± 1.0 fF) of EGTA. One-way ANOVA did not show significant difference (p = 0.098). D, Comparison of ΔCm in response to voltage steps of 500 ms pulse from −90 mV to −30 mV using 0.1 mM (light gray, n = 16, 203.8 ± 34.8 fF), 2 mM (black, n = 34, 147.3 ± 9.1 fF), and 10 mM (gray, n = 13, 104.1 ± 8.5 fF) of EGTA. The ΔCm jumps in panels C and D were measured after 4 min from whole-cell break-in to allow for the full diffusion of EGTA into the hair cell. One-way ANOVA followed the Bonferroni test showed significant difference (overall: p = 0.006).

