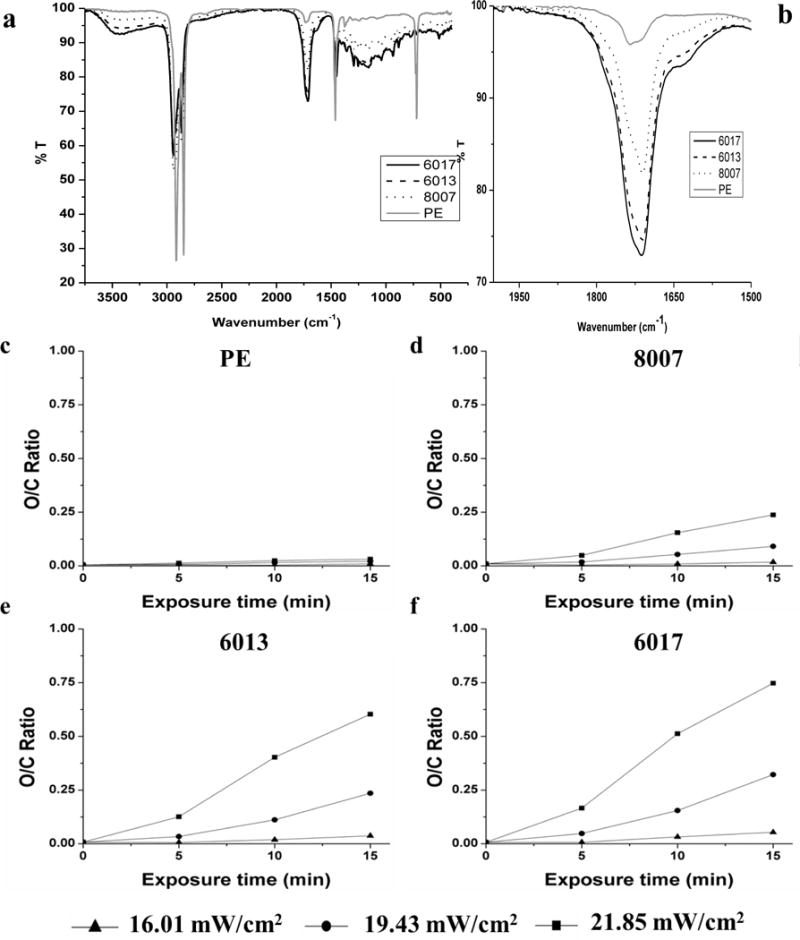
Figure 2.

ATR-FTIR analysis of UV/O3-activated TOPAS COC and PE. a) ATR-FTIR spectrum of PE and COC exposed to 21.85 mW/cm2 of UV/O3 for 15 min. b) Sub-section of the spectrum seen in (a) showing the carbonyl region of the spectrum. c–f) Oxygen to carbon ratio versus exposure time for various power levels of UV/O3 activation for PE, COC 8007, COC 6013 and COC 6017, respectively. The lines connecting the data points do not represent a functional relationship within a series, but are used for clarity of presentation only.
