
Figure 3.
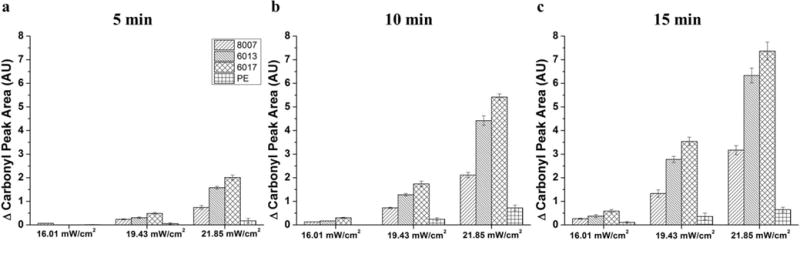
Change in the carbonyl peak area of the ATR-FTIR spectra versus the UV/O3 activation power for: a) 5 min exposure; b) 10 min exposure; and c) 15 min exposure. Error bars represent ±std of the average carbonyl peak area (n=5)
Official websites use .gov
A
.gov website belongs to an official
government organization in the United States.
Secure .gov websites use HTTPS
A lock (
) or https:// means you've safely
connected to the .gov website. Share sensitive
information only on official, secure websites.
Change in the carbonyl peak area of the ATR-FTIR spectra versus the UV/O3 activation power for: a) 5 min exposure; b) 10 min exposure; and c) 15 min exposure. Error bars represent ±std of the average carbonyl peak area (n=5)