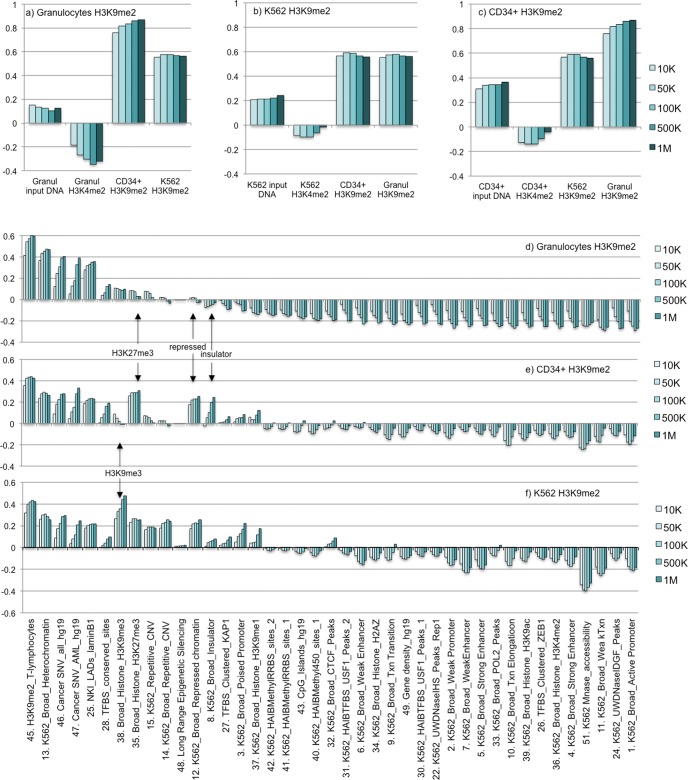
Fig 2. Genome-wide correlation analysis of H3K9me2 domains in myeloid cells.
a-c): graphs showing Pearson correlation values for normal granulocytes (a), K562 (b), and CD34+ H3K9me2 (c) ChIP HMM domains vs: input DNA, H3K4me2 ChIP HMM domains, and H3K9me2 ChIP HMM domains from the two other samples as indicted. The five columns in each sample show correlation values for 10K, 50K, 100K, 500K, and 1M windows (left to right). d-f): graphs show Pearson correlations between granulocyte (d), CD34+ (e), and K562 (f) H3K9me2 HMM domains vs. indicated biodata from human genome-wide databases (for references see Materials and Methods and S4 Table).

