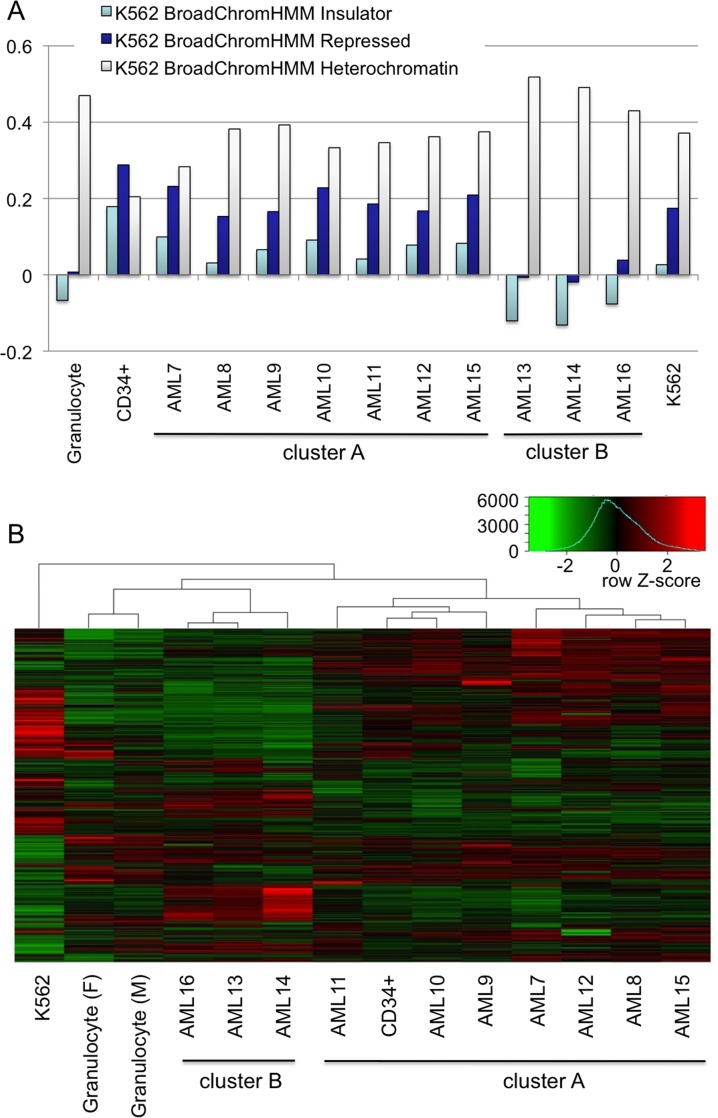
Fig 3. Analysis of H3K9me2 correlations in AML cells and identification of two epigenetically different types of AML.
A: Graphs showing correlations between Granulocyte, CD34+ progenitors, 10 AML samples, and K562 H3K9me2 HMM domains vs. selected biodata with top discriminatory power (insulator, repressed chromatin, and heterochromatin). B: Hierarchical cluster analysis of genome-wide H3K9me2 distribution for 10 AML samples, CD34+, granulocytes, and K562 cells. The insert on top shows the color key and histogram for H3K9me2 enrichment/depletion score.

