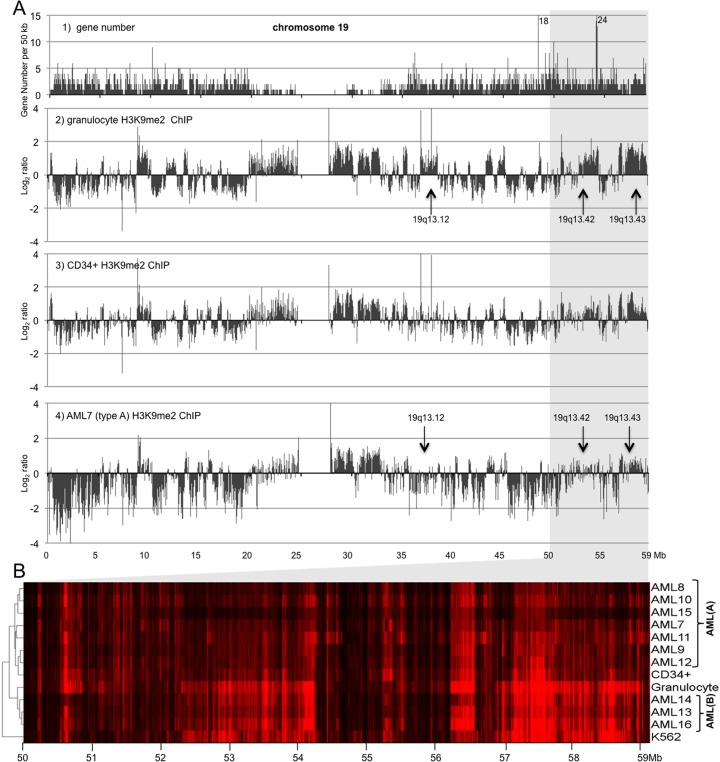
Fig 4. Mapping of H3K9me2 blocks shows consistent alterations associated with myeloid differentiation and AML.
A: 50K resolution maps of chromosome 19 showing gene density (1) and H3K9me2 ChIP-sequence reads (Bowtie) of human granulocytes (2), normal CD34+ cells (3), and AML myeloblasts (4). Sequence reads were normalized to average and plotted in Log2 scale. Red arrows show difference in H3K9me2 levels at three loci at chromosome 19. B: Hierarchical cluster analysis of H3K9me2 distribution over the chromosome 19 (50–59.12 Mb) locus for 10 AML samples, CD34+, granulocytes, and K562 cells.

