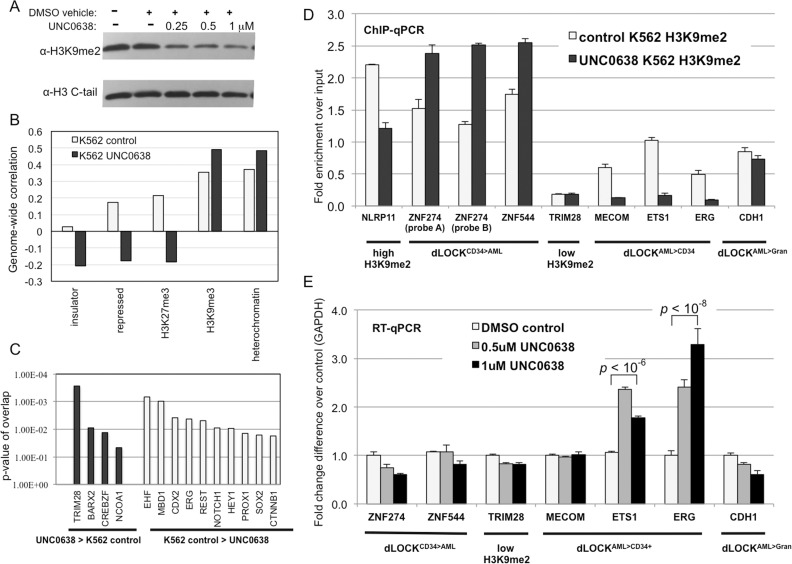
Fig 7. Inhibition of G9a/GLP in K562 decreases H3K9me2 levels and activates genes within AML-enriched transient H3K9me2 blocks.
A: Western blotting probed with antibodies against H3K9me2 and unmodified histone H3 show decreasing levels of H3K9me2 in K562 cells treated with G9a/GLP inhibitor UNC0638. B: Graphs showing correlations between H3K9me2 domains in control and 1 μM UNC0638-treated K562 cells vs. selected biodata with top discriminatory power (insulator, repressed chromatin, H3K27me3, H3K9me3, and heterochromatin). C: Ingenuity pathway analysis showing upstream regulators associated with the dLOCKUNC0638>K562control and dLOCKK562control>UNC0638. D: H3K9me2 levels determined by ChIP-qPCR in control and UNC0638-treated K562 cells for selected gene probes representing dLOCKCD34+>AML (ZNF274, ZNF544), constitutively high H3K9me2 (NLRP11), constitutively low H3K9me2 (TRIM28), dLOCKAML>CD34+ (MECOM, ETS1, ERG) and dLOCKAML>Gran (CDH1). E: RT-PCR analysis of gene expression level in control and UNC0638-treated K562 cells for selected gene probes representing dLOCKCD34+>AML (ZNF274, ZNF544), constitutively low H3K9me2 (TRIM28), dLOCKAML>CD34+ (MECOM, ETS1, ERG) and dLOCKAML>Gran (CDH1). p–values represent Student’s t-test for 2 tailed, unpaired equal variance.

