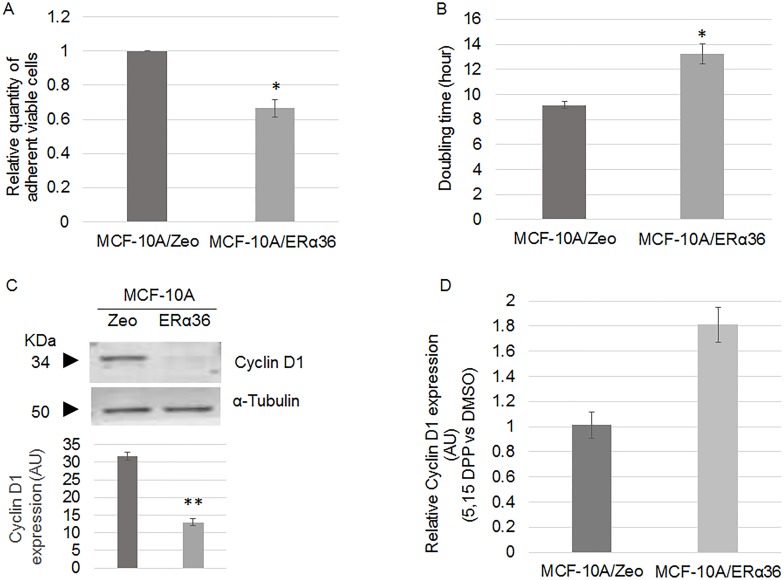
Fig 2. ERα36 overexpression lowers MCF-10A cell proliferation rate.
A. Quantification of MCF-10A/Zeo and MCF-10A/ERα36 cell viability by crystal violet assay after 48h culture. ERα36 overexpression triggers a 35% decrease of cell proliferation. Each bar represents mean ± S.E.M. N = 3. *: P<0.05. B. Doubling time of MCF-10A/Zeo and MCF-10A/ERα36 cells was measured by crystal violet cell counting at t = 0 (immediately after seeding), t = 24h, 48h and 72h of culture. Given the measurements of living cells at t = 72h and t = 0, doubling time was calculated assuming a constant growth rate. Each bar represents mean ± S.E.M. N = 4. *: P<0.05. C. Representative western blot analysis of Cyclin D1 expression in MCF-10A/Zeo and MCF-10A/ERα36 cells (left panel). α-Tubulin was used as a loading control. Quantification of corresponding band intensity (right panel) indicate a 60% decrease of cyclin D1 expression in MCF-10A/ERα36 compared to MCF-10A/Zeo cells. Each bar represents mean ± S.E.M. N = 3. **: P<0.01. D. Relative Cyclin D1 expression in MCF-10A/Zeo and MCF-10A/ERα36 cells after 24h DMSO or 10μM 5,15 DPP exposure. Results depicted in the histogram are represented as 5,15 DPP versus DMSO ratio. In the presence of 5,15 DPP, cyclin D1 protein expression increases by 81% only in MCF-10A/ERα36 cells.

