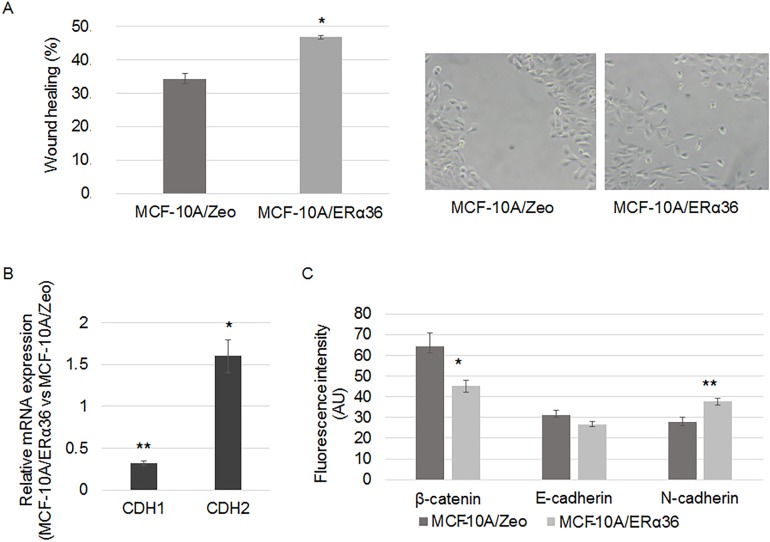
Fig 4. ERα36 overexpression enhances migratory potential.
A. A wound was performed on a confluent monolayer culture of MCF-10A/Zeo and MCF-10A/ERα36 cells. Histogram depicts the wound healing when measured after a 6-hour culture (left panel). A representative picture of the migrating MCF-10A/ERα36 cells is presented in the right panel. Each bar represents mean ± S.E.M. N = 5. *: P <0.05. B-C. MCF-10A/Zeo and MCF-10A/ERα36 were cultured for 24 hours. B. CDH1 and CDH2 gene expression was measured by RT-PCR analysis. The housekeeping gene RPLPO was used as the reference gene. Each bar represents mean ± S.E.M. N = 3. *: P <0.05. **: P <0.01. C. Expression of cell-cell adhesion proteins was studied by immunofluorescence with specific antibodies: anti-β-catenin, anti-E-cadherin and anti-N-cadherin (AlexaFluor 555). Average fluorescent signal intensities are quantified from 5 cells from 5 fields per condition. Each bar represents mean ± S.E.M. N = 3. *: P <0.05, ** P <0.01.

