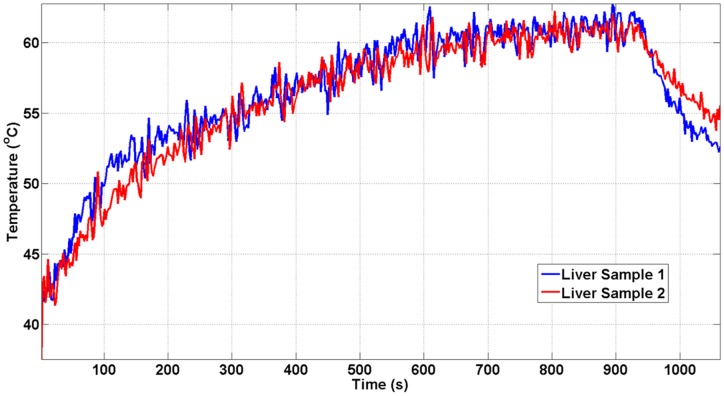
Fig 8. Temperature change measured at the first coronal slice for separate liver samples.
The sonication parameters for both liver samples were 650 W of acoustic power, 15,000 cycles/pulse at 1 Hz PRF. The peak temperature was reached at the end of the sonication (64°C). Both temperature curves show similar dynamics.

