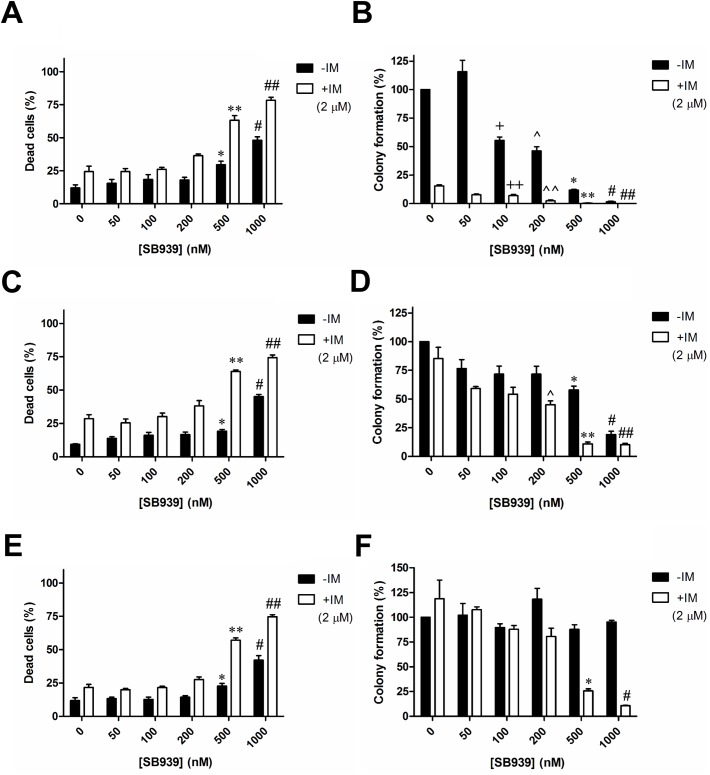
Fig 3. SB939, in combination with IM, significantly reduces the colony-forming ability of CML cell lines with the BIM deletion polymorphism.
Results of apoptotic cell death, as assessed by flow cytometry-based Annexin V assay, for K562 (A) BIMi2+/+, (C) BIMi2+/- and (E) BIMi2-/- cells are shown. The P values were based on Student’s t test. Apoptotic cell death: *P = 0.0078 and #P = 5 X 10⁻⁴ in (A), *P = 0.011 and #P = 9.6 X 10⁻⁴ in (C), *P = 0.018 and #P = 0.0033 in (E), were calculated by comparing with their respective DMSO-treated control samples. **P = 0.0022 and ##P = 0.0013 in (A), **P = 0.0032 and ##P = 4.8 X 10⁻⁴ in (C), **P = 3.3 X 10⁻⁴ and ##P = 10−4 in (E), were calculated in comparison with samples treated with IM only. Results of the colony formation assay for K562 (B) BIMi2+/+, (D) BIMi2+/- and (F) BIMi2-/- cells are shown. Colony formation for each sample was calculated as a percentage of the total number of colonies counted from the corresponding DMSO-treated control. The P values were based on Student’s t test. Colony formation assay: +P = 0.0045, ^P = 0.0047, *P = 6 X 10⁻⁵ and #P = 3 X 10⁻⁵ in (B), *P = 0.0059 and #P = 0.0014 in (D), were calculated by comparing their respective colony formation to that of the DMSO controls. ++P = 0.0038, ^^P = 4.8 X 10⁻⁴, **P = 0.0026 and ##P = 0.0035 in (B), ^P = 0.041, **P = 0.014 and ##P = 0.015 in (D), *P = 0.038 and #P = 0.029 in (F), were calculated by comparing their respective colony formation to that of the sample treated with IM only. Cells were treated with either or both SB939 (0-1000nM) and imatinib (2uM) for 72 hours. All results are given as the mean ± s.e.m (n = 3).

