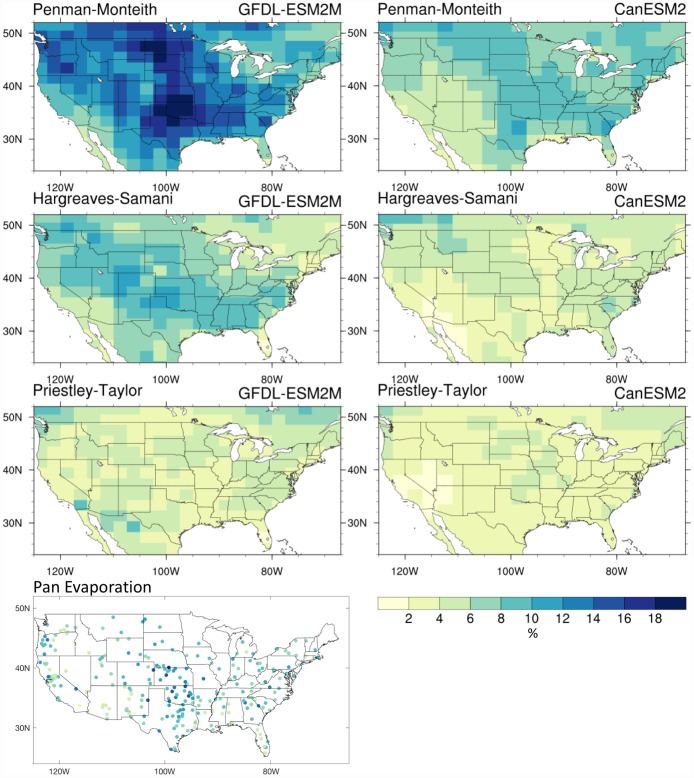
Fig 3. Historical coefficient of variation across the different E0 formulations.
E0 coefficient of variation (CV, times 100 for %) across the CONUS for MJJAS in GFDL-ESM2M (first three plots in left column) and CanESM2 (right column) as estimated by the Penman-Monteith (first row), Hargreaves-Samani (second row), and Priestley-Taylor (third row) formulations for the 1976–2005 period. The bottom left plot shows the CV of observed MJJAS pan evaporation across the CONUS from 228 stations which had at least 20 years of data between 1950 and 2001.

