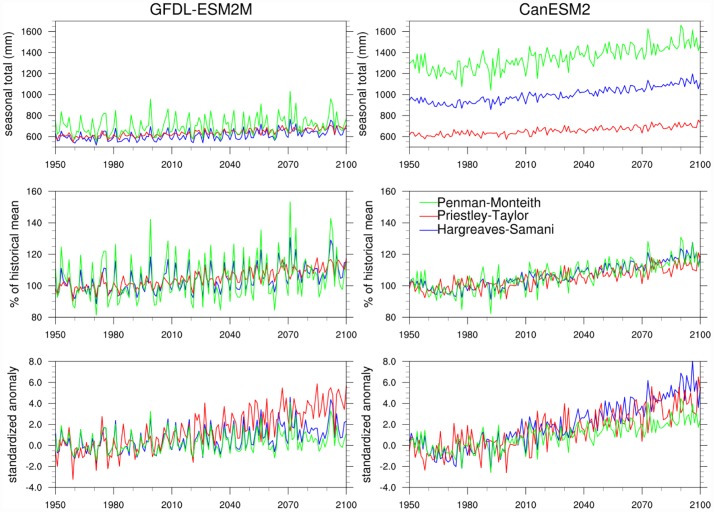
Fig 5. 21st century trends in E0 across the different E0 formulations.
Trends in MJJAS E0 projected from Penman-Monteith (green), Hargreaves-Samani (blue), and Priestley-Taylor (red) formulations driven by GFDL-ESM2M and CanESM2 data for the Northern Great Plains. The top row shows seasonal totals in mm, center row shows E0 anomalies as % of the 1976–2005 mean, and bottom row shows standardized E0 anomalies.

