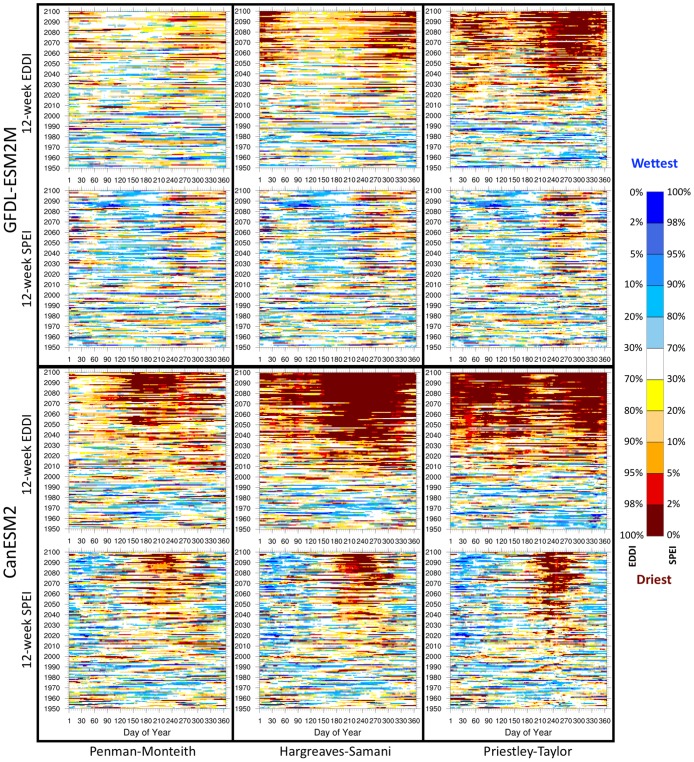
Fig 7. 21st century trends in EDDI and SPEI.
Comparison of 12-week EDDI and SPEI computed with the three E0 formulations for each day between 1950–2100 for GFDL-ESM2M and CanESM2 for the Northern Great Plains region. Daily EDDI or SPEI values are binned into specific percentile categories (spanning between driest and wettest categories) relative to the historical (1976–2005) distribution.

