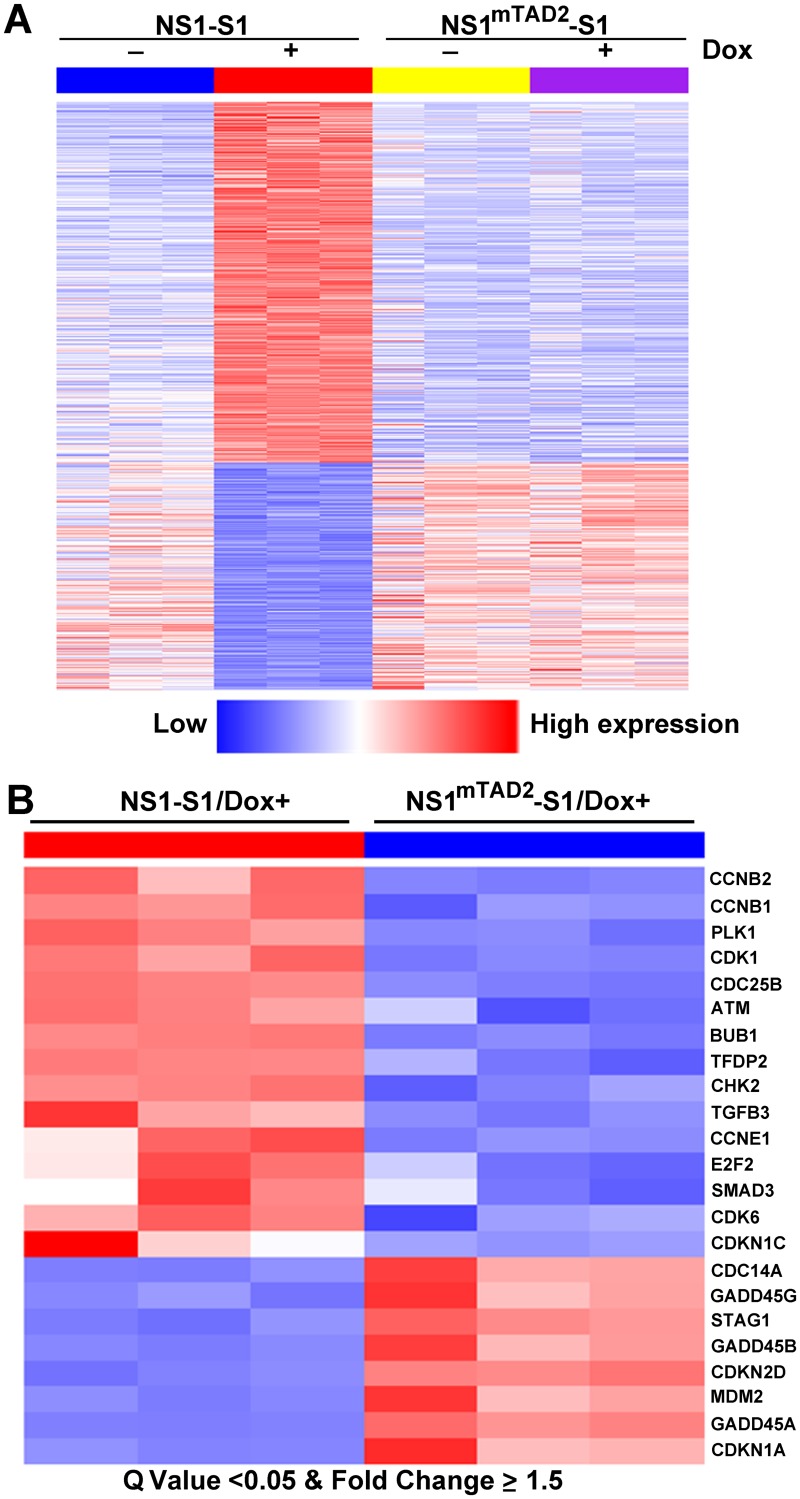
Fig 2. Transcriptomes of NS1-S1 and NS1mTAD2-S1 cell lines treated with or without Dox.
(A) Heatmap of 1,770 genes differentially expressed between NS1-S1 and NS1mTAD2-S1 cell lines (Gene set 5). First, genes differentially expressed between NS1-S1 cell lines treated with and without Dox (NS1-S1 Dox+/-; Gene set 1) and between both NS1-S1 and NS1mTAD2-S1 cell lines treated with Dox (NS1-S1/Dox+ and NS1mTAD2-S1/Dox+; Gene set 2) were identified. Gene set 3 contains overlapped differential genes both in Gene sets 1 and 2. Next, genes differentially expressed between NS1mTAD2-S1 cells treated with and without Dox (NS1mTAD2-S1 Dox+/-) were identified as Gene set 4. Finally, Gene set 5, which represents the genes regulated by NS1 TAD2, was obtained by subtracting Gene set 4 from Gene set 3, and is shown. (B) Heatmap of 23 KEGG cell cycle genes showing significant differential expression between NS1-S1/Dox+ and NS1mTAD2-S1/Dox+ (Q value < 0.05 and fold change ≥ 1.5). Each column represents gene expression data for a NS1-S1 or a NS1mTAD2-S1 cell line (n = 3/cell line). Each row represents a gene. Red indicates increased expression. Blue indicates decreased expression.

