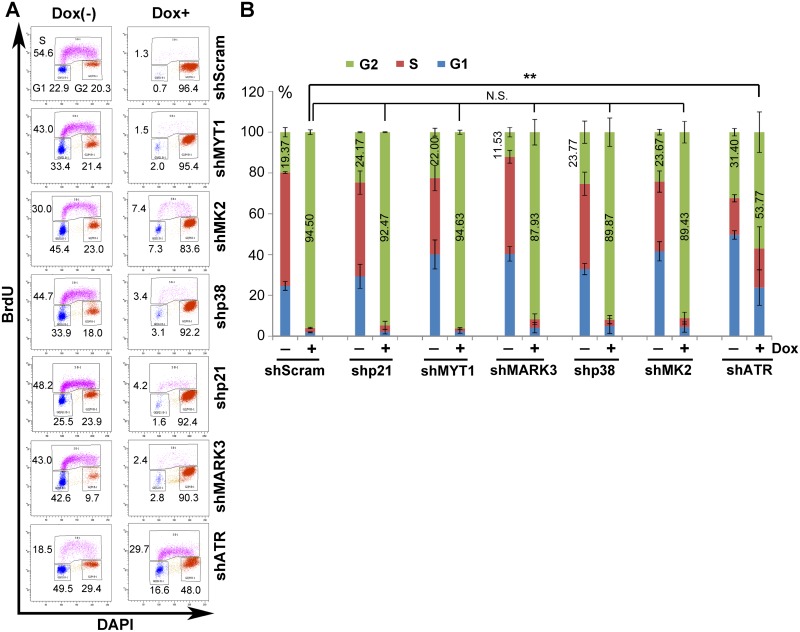
Fig 6. Knockdown of ATR diminishes NS1-induced G2-phase arrest in UT7/Epo-S1 cells.
(A) Cell cycle analysis. NS1-S1 cells were transduced with shRNA-expressing lentivirus as indicated. After 48 h, cells were treated with Dox at 5 μg/ml (Dox+) or without (Dox-). After 72 h, the cells were collected and co-stained with an anti-BrdU antibody and DAPI. Cell cycle analysis of mCherry-expressing cells is shown. (B) Statistical analyses. The percentage of cells at G1-, S-, and G2-phase after shRNA transduction is depicted in color. The numbers show the percentages of the cells at G2-phase. The percentage of shScram and other shRNAs transduced NS1-expressing cells at G2-phase was statistically analyzed. **P<0.01, and N.S. represents no significance.

