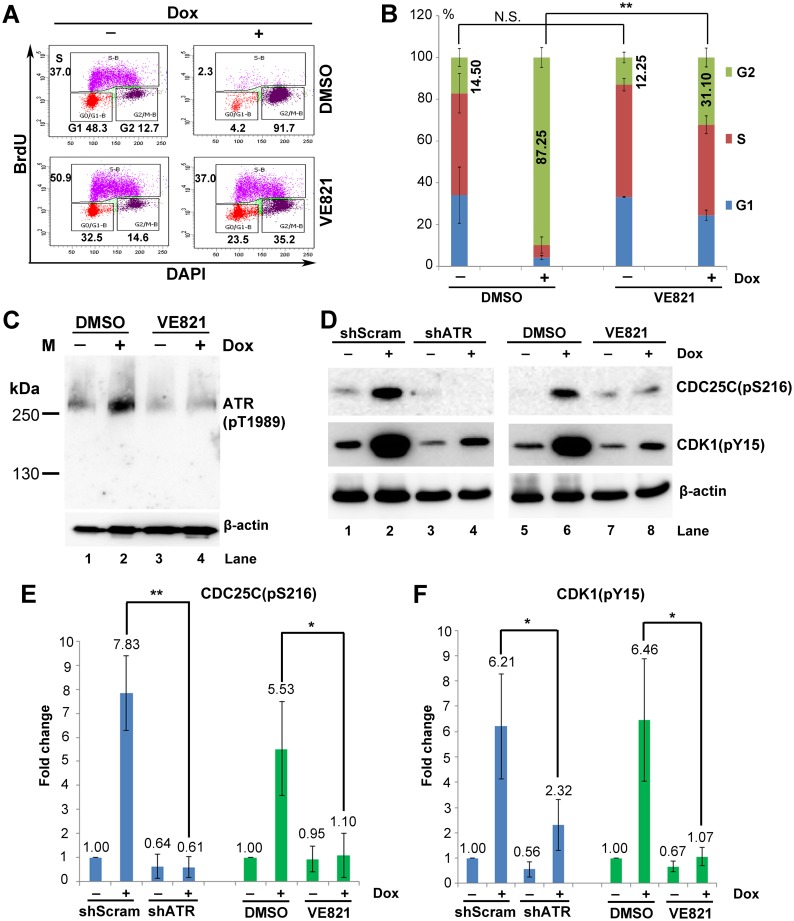
Fig 7. Inhibiting ATR phosphorylation abolishes NS1-induced G2-phase arrest in UT7/Epo-S1 cells.
(A) Cell cycle analysis. NS1-S1 cells were treated with the ATR-specific inhibitor VE821 at 3 h prior to Dox treatment. At 72 h post-treatment, the cells were then collected and co-stained with an anti-BrdU antibody and DAPI prior for flow cytometry. DMSO-treated NS1-S1 cells were used as a control. (B) Statistical analyses. The percentage of the cells at each stage of the cell cycle is depicted in color. Numbers shown are the percentages at G2-phase and are statistically compared within cell groups treated with or without Dox induction as indicated. **P<0.01, and N.S. represents no significance. (C) ATR inhibition. After treatment with DMSO or VE821, cells were collected, and expression of ATR(pT1989) was examined by Western blotting. (D) Activation of the ATR-CDC25C-CDK1 pathway. NS1-S1 cells were either transduced with lentivirus harboring scramble or ATR-specific shRNA for 48 h, or treated with DMSO and VE821, and then treated with Dox for 72 h. The cells were then collected, lysed, and immunoblotted with the indicated antibodies. (E&F) Quantification. The detected bands of CDC25C(pS216) and CDK1(pY15) shown in panel D were quantified, and the results are expressed as the mean ± standard deviation of at least three independent experiments. Statistical analysis was performed in paired groups as indicated. **P<0.01, and *P<0.05.

