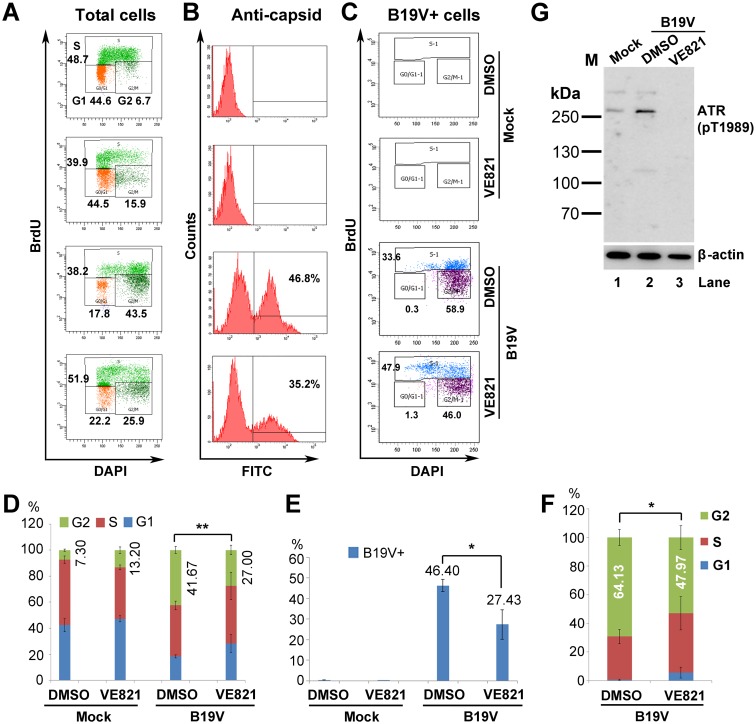
Fig 9. Inhibition of ATR activation significantly decreases B19V-induced G2 arrest in infected CD36+ EPCs.
(A–C) B19V infection and cell cycle analysis. CD36+ EPCs were treated with VE821 for 3 h prior to B19V or mock infection. After 48 h, cells were collected, stained with an anti-capsid antibody, and cell cycle phase was examined by flow cytometry. (A) Total cells were selected for cell cycle analysis. (B) Percentage of B19V capsid-expressing cells were analyzed. (C) Anti-capsid staining-positive were selected for cell cycle analysis. (D–F) Statistical analyses. (D) The percentage of cells treated with DMSO or VE821 that were at G1-, S-, and G2-phase is depicted in color. The numbers shown are the percentages of the cells at G2, and are statistically compared as indicated. (E) The percentage of anti-capsid positive (B19V+) cells is shown the mean ± standard deviation of at least three independent experiments. (F) The percentage of capsid-expressing cells at G1-, S-, and G2-phase is depicted in color. The numbers shown are percentages of the cells at G2. **P<0.01 and *P<0.05. (G) Western blot analysis. CD36+ EPCs were either treated with DMSO or VE821 at 3 h prior to B19V infection or mock-infection. After 48 h, cells were collected for Western blotting to detect ATR(pT1989).

