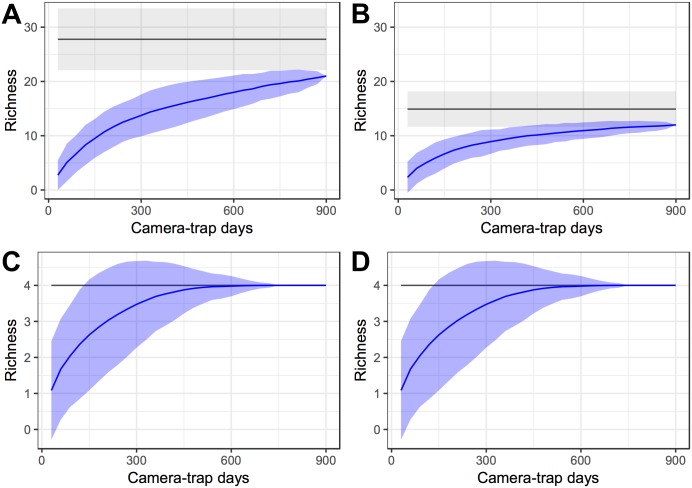
Fig 2. Cumulative curves for mammal and bird species sampled with camera traps in the dry season in the Amapá National Forest.
Detection of species recorded in 900 camera-trap days randomized 1000 times and results used to derive mean (blue line) 95% confidence intervals of the mean (blue polygon). First order jackknife estimates of extrapolated species richness and 95% confidence intervals are showed with black line and light gray shaded area, respectively. (A) Cumulative curve for all mammal species; (B) Cumulative curve for frugivorous mammals; (C) Cumulative curve for all bird species; (D) Cumulative curve for frugivorous birds.

