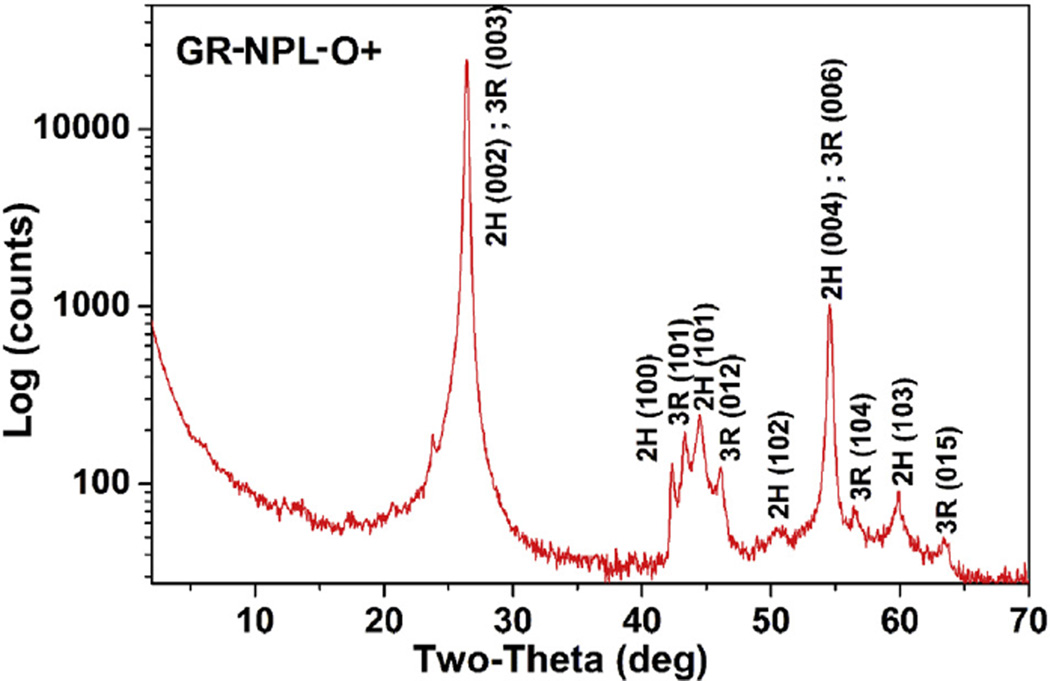
Fig. 2.
X-ray diffraction pattern of one of the samples of Table 1. The Miller indices of the observed lines for the 2H and 3R phases are respectively based on ICDD-PDF #-041-1487 and # 026-1079. (A colour version of this figure can be viewed online.)

