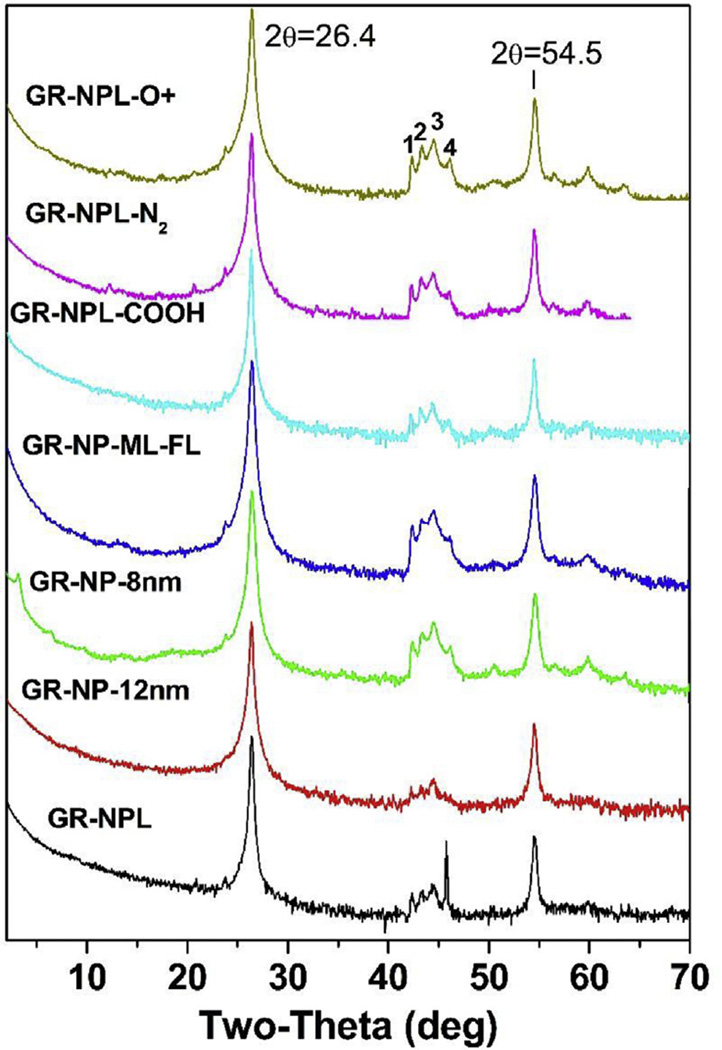
Fig. 4.
XRD patterns of the seven samples of Table 1 are compared with the name of a sample listed on each plot. The plots are stacked vertically for comparison and log scale is used for counts as in Fig. 2. The region of the lines marked 1,2,3,4 is expanded in Fig. 5. (A colour version of this figure can be viewed online.)

