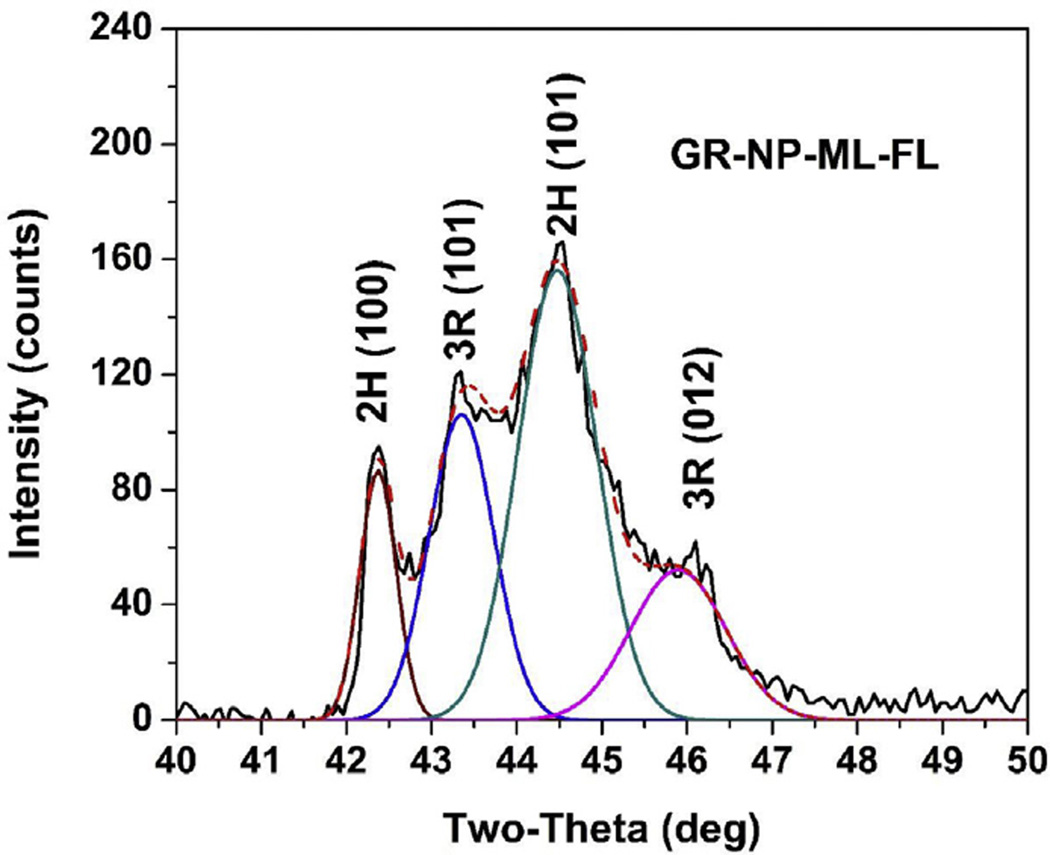
Fig. 6.
Illustration of the deconvolution of the lines of one sample in the region of 2θ = 40° to 48°. Areas under the peaks marked 2H (101) and 3R (101) are used to determine the relative % of 2H and 3R phases listed in Table 1. (A colour version of this figure can be viewed online.)

