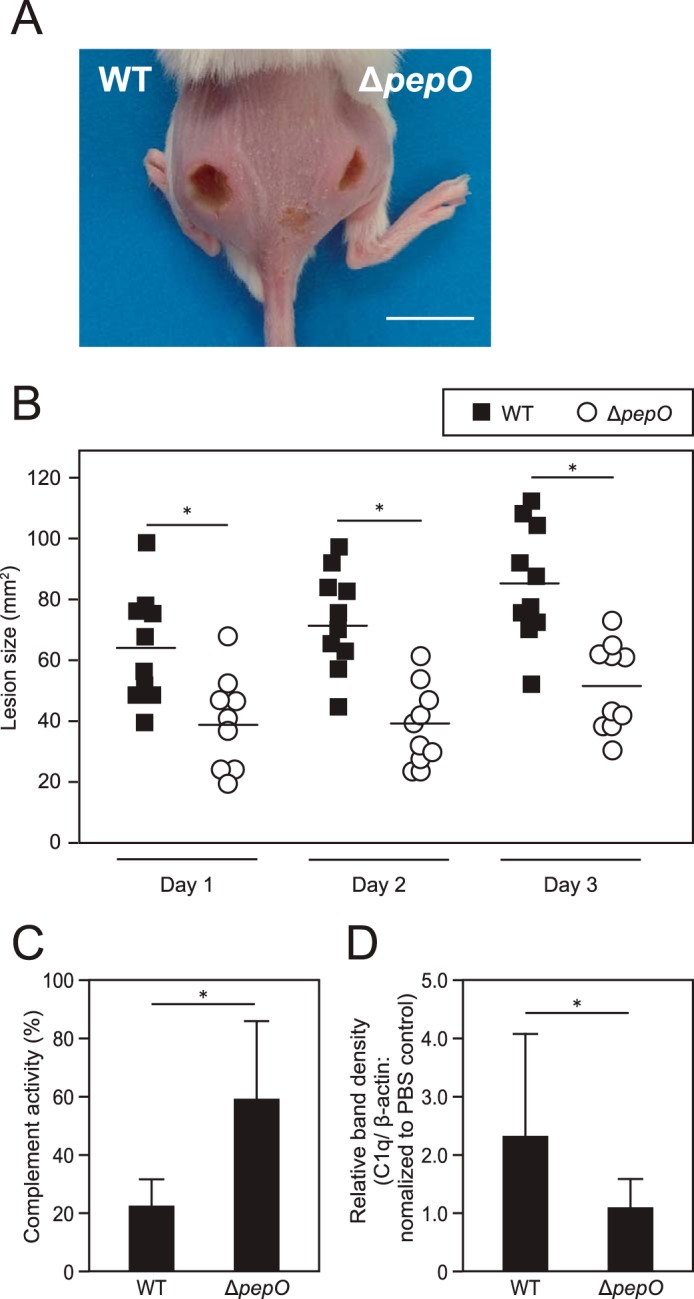
FIGURE 6.

Effects of PepO on development of mouse skin lesions. A, WT (left) and ΔpepO (right) were separately injected in an intradermal manner into depilated mice skin. A representative image at 3 days after infection is shown (bar = 10 mm). B, lesion size was examined daily for up to 3 days after infection (bar represents mean of lesion size). Statistical significance was calculated using a Mann-Whitney U test. *, p < 0.01. C, hemolytic activity in tissues infected with WT or ΔpepO was measured using antibody-coated erythrocytes. The degree of hemolysis was determined by measuring of hemoglobin released from lysed erythrocytes by the membrane attack complex. The value for absorbance of the sample obtained from the PBS-injected tissue in each mouse was set as 100% complement activity. Statistical significance was calculated using a Mann-Whitney U test. *, p < 0.05. Error bars represent S.D. D, the C1q levels in lesions formed following infection with WT or ΔpepO were determined using Western blot analysis. The obtained band density of C1q in each tissue sample was normalized to that of β-actin as a loading control, then the relative amount of C1q to that in PBS-injected tissue was calculated. Statistical significance was calculated using a Mann-Whitney U test. *, p < 0.05. Error bars represent S.D. Representative data obtained from three independent experiments are shown.
