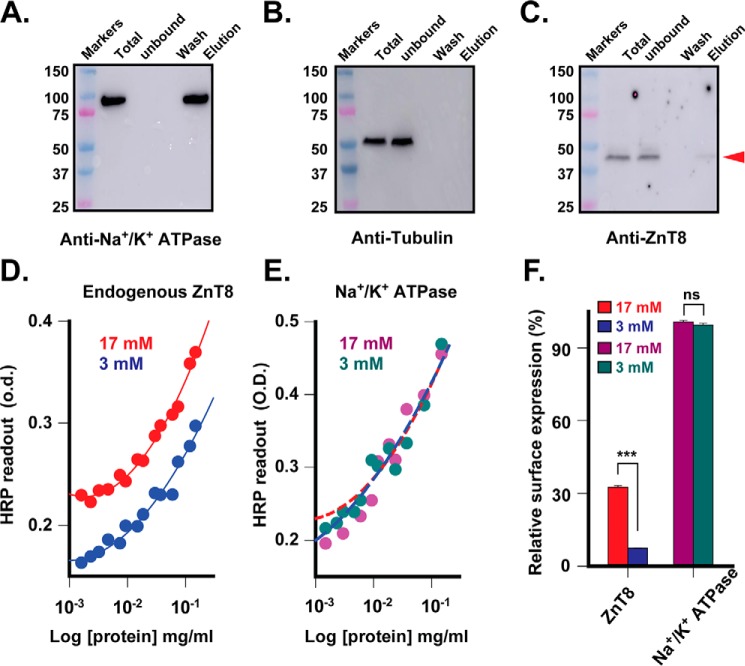
FIGURE 6.
GSIS-dependent surface display of endogenous ZnT8. A–C, anti-Na+/K+ ATPase, anti-tubulin, and anti-ZnT8 Western blotting analysis of surface biotinylation of live INS-1E cells. Biotinylated proteins were captured by streptavidin-coated magnetic beads, washed, and then eluted for immunoblotting analysis using a respective primary antibody as indicated. The red arrow indicates endogenous ZnT8. D, ELISA readouts of surface displayed ZnT8 on INS-1E cells that were exposed to 3 (blue) or 17 mm (red) glucose. Solid lines are standard curves generated by least squares fits of serial dilution data points to a second order logarithmic equation. E, quantification of surface-displayed ZnT8. Anti-Na+/K+ ATPase ELISA readouts are shown for serial dilutions of the identical cell lysate used in D. Magenta or dark cyan circles are anti-Na+/K+ ATPase readouts measured with 17 or 3 mm glucose. Dashed lines are least square fits of anti-ZnT8 standard curves in D to the anti-Na+/K+ ATPase data points using the -fold difference between biotinylated ZnT8 and Na+/K+ ATPase as a fitting parameter. Red or blue dash lines show the fit of 17 or 3 mm glucose data points. F, glucose-stimulated ZnT8 surface display. The values of relative surface expression were obtained from E in reference to the average level of the housekeeping Na+/K+ ATPase. Bars are the means ± S.E. from least-squares fitting (ns, p > 0.1; ***, p < 0.001).

