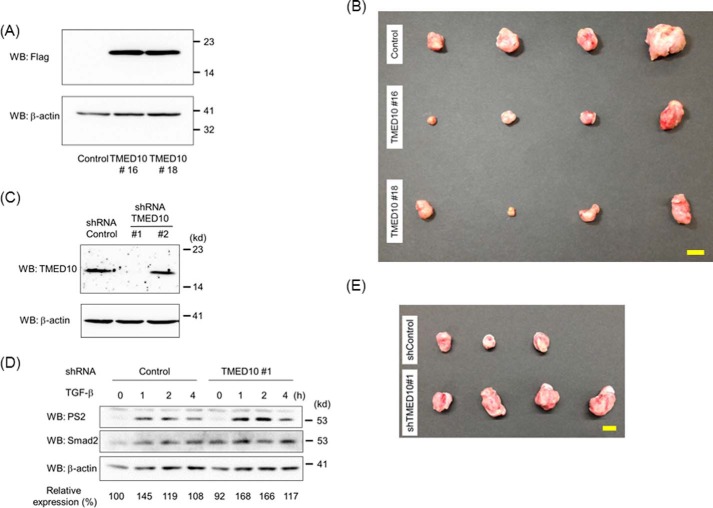
FIGURE 7.
Xenograft implantation of mammary tumors carrying TMED10/FLAG or TMED10 shRNA. A, expression of TMED10/FLAG in JygMC(A) cells with TMED10. After JygMC(A) cells carrying control, TMED10#16, or TMED#18 were established, the cell lysates were prepared. Western blotting analyses (WB) were then carried out using anti-FLAG (top panel) and anti-β-actin (bottom panel) antibodies. B, effect of TMED10 expression in JygMC(A) cells on primary tumors. Photos of tumors derived from JygMC(A) cells carrying control, TMED10#16, or TMED#18 are shown. Scale bar: 10 mm. C, expression of TMED10 in JygMC(A) cells with the introduced TMED10 shRNA. After JygMC(A) cells carrying control, shTMED10#1, or shTMED10#2 were established, the cell lysates were prepared. Western blotting analyses were then carried out using anti-TMED10 (top panel) and anti-β-actin (bottom panel) antibodies. D, extension of TGF-β-induced Smad2 phosphorylation in JygMC(A) cells in which the TMED10 expression was reduced. Cells were stimulated with 0.25 ng/ml TGF-β for the indicated times. Western blotting analyses were performed as described in Fig. 2F. The top, middle, and bottom panels show the expressions of phosphorylated Smad2, Smad2, and β-actin, respectively. The expression of phosphorylated Smad2 upon TGF-β stimulation was normalized using the intensity of the band corresponding to Smad2. Relative expression was calculated relative to the value for control cells in the absence of TGF-β. E, effect of shTMED10 expression in JygMC(A) cells on primary tumors. Photos of tumors derived from JygMC(A) cells carrying control shRNA or shTMED10#1 are shown. Scale bar: 10 mm.

