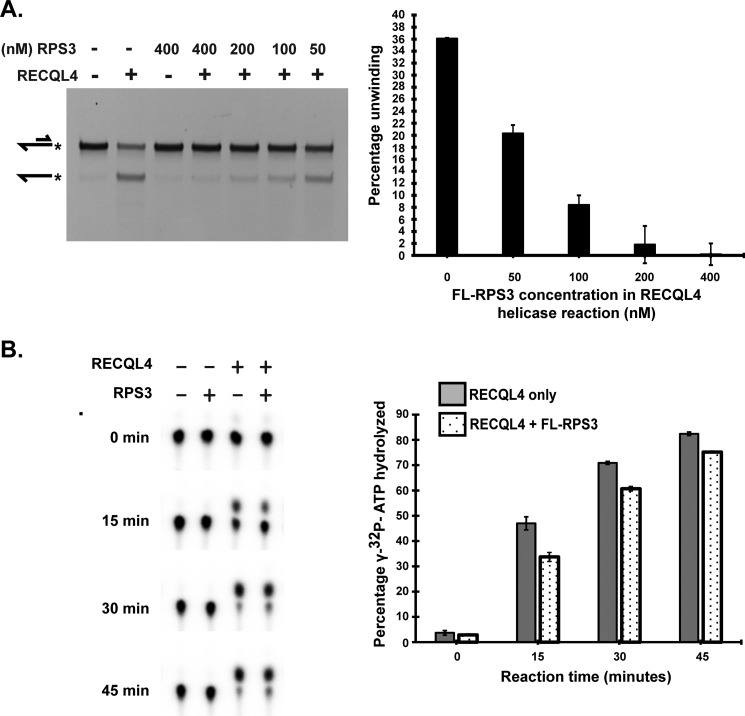
FIGURE 3.
RPS3 inhibits helicase and ATPase activity of RECQL4. A, representative PAGE showing the RECQL4 helicase assay performed in the presence or absence of indicated concentrations of FL-RPS3 (1–244 aa). All helicase reactions contain 50 nm RECQL4 protein and 20 nm 5′FAM-labeled 3′ overhang substrate. Substrate and product structures are illustrated on the left side of the gel. * represents position of the FAM label on the substrate. Bar graph depicting percentage unwinding against the concentration of RPS3 protein in the helicase reaction. The data points shown are the means of triplicate experiments with S.D. indicated as error bars. B, ATPase activity of RECQL4 assayed using TLC. Of a total 20-μl reaction, 1 μl (with 400 nm RPS3, 80 nm of RECQL4, and 3.4 nm [γ-32P]ATP substrate) was taken for TLC analysis at indicated time points. Bar graph showing percentage of [γ-32P]ATP hydrolyzed in the presence (dotted bars) or absence (shaded bars) of FL-RPS3 plotted against the reaction time course. The data points shown are the means of triplicate experiments with S.D. indicated as error bars.

