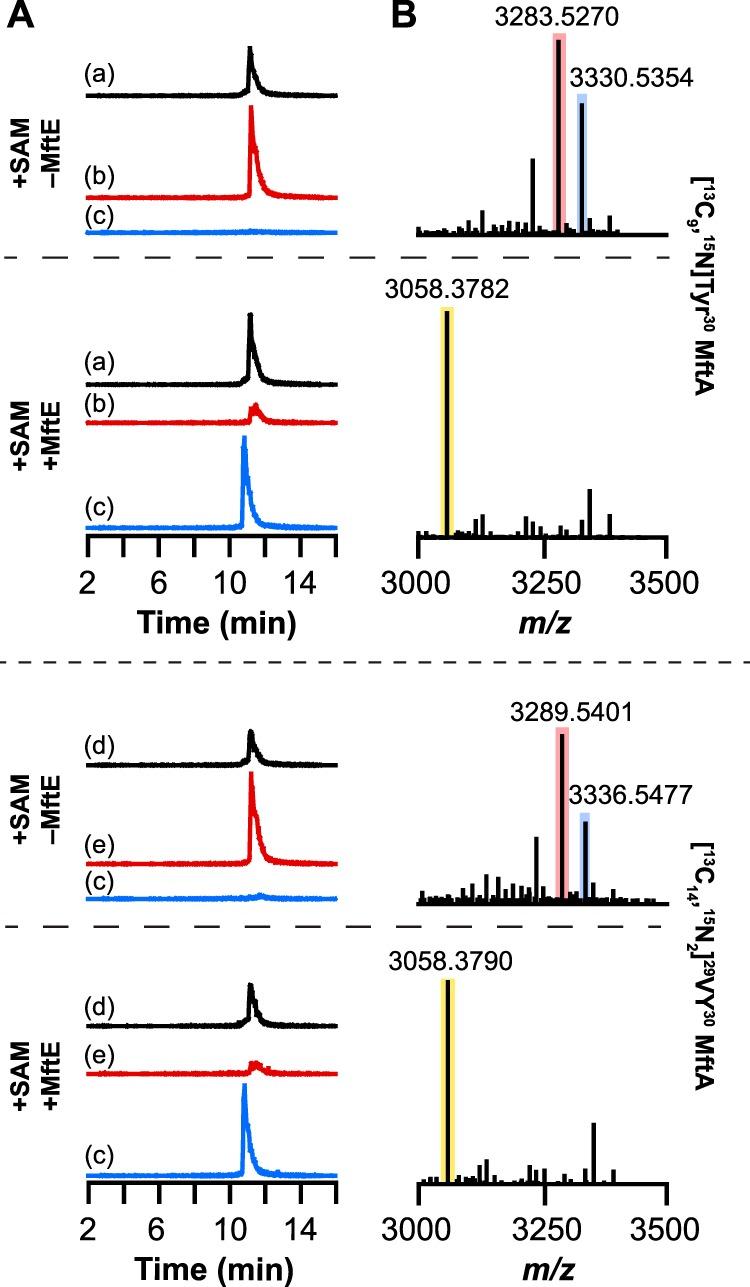
FIGURE 4.

UHPLC-MS analysis of MftA peptide isolated from reactions containing either [13C9,15N]Tyr30 MftA or [13C14,15N2]29VY30 MftA. A, the extracted ion chromatograms of reactions in the presence or absence of MftE. The chromatograms correspond to the +2 charge state of unmodified [13C9,15N]Tyr30 MftA (m/z = 1665.5–1666.5) (a), oxidatively decarboxylated [13C9,15N]Tyr30 MftA (m/z = 1642–1643) (b), MftA(1–28) (m/z = 1529.5–1530.5) (c), unmodified [13C14,15N2]29VY30 MftA (m/z = 1668.5–1669.5) (d), and oxidatively decarboxylated [13C14,15N2]29VY30 MftA (m/z = 1645–1646) (e). B, the deconvoluted mass spectra generated from the corresponding full mass spectra shown in supplemental Fig. S3. Regardless of which isotopically enriched MftA peptide was used, the new species observed in the extracted ion chromatograms of reactions containing both SAM and MftE has the same mass as the new product observed with natural abundance MftA corresponding to MftA(1–28) shown in Fig. 2B. The blue, red, and yellow boxes correspond to unmodified MftA, oxidatively decarboxylated MftA, and MftA(1–28), respectively.
