. 2017 Feb 13;6:e21069. doi: 10.7554/eLife.21069

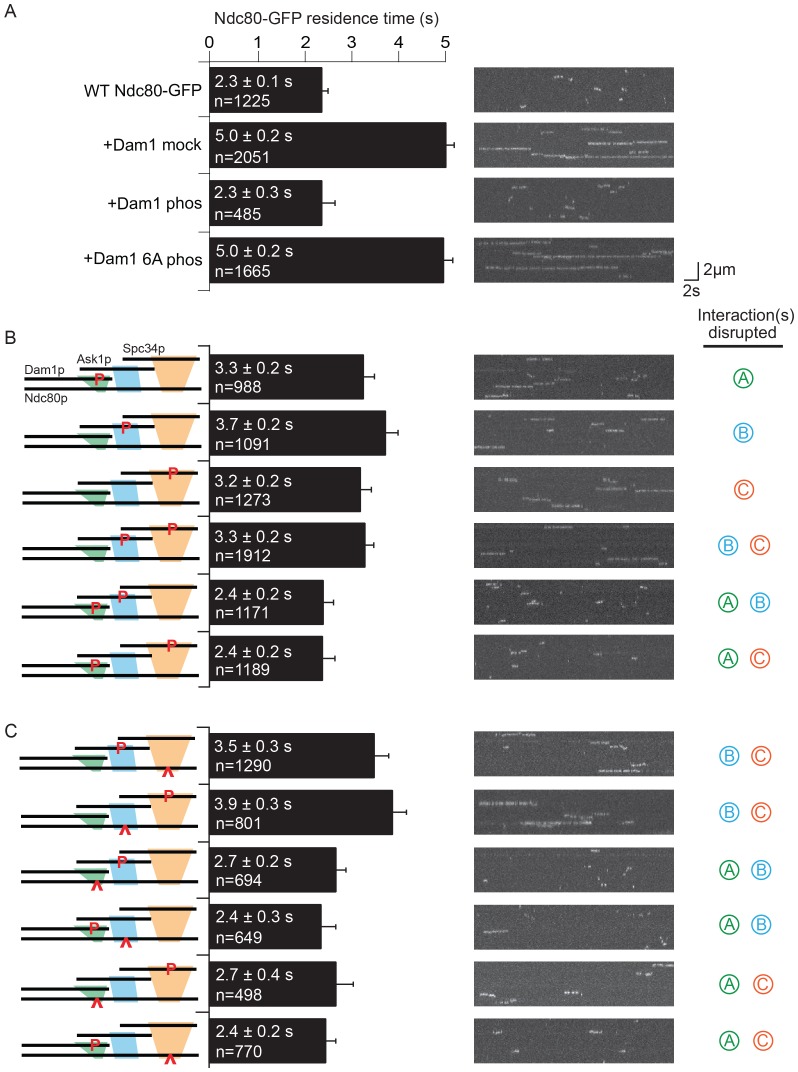
Figure 2. Dam1 and Ndc80 complexes interact through three distinct sites.

(A) Average microtubule residence time of the wild-type Ndc80-GFP complex alone, in the presence of mock treated, phosphorylated Dam1 complex, or phosphorylated Dam1 6A mutant complex. Dam1 6A: all six Dam1 complex phosphorylation sites mutated to Ala. (B) Average microtubule residence time of wild-type Ndc80-GFP complex in the presence of selectively phosphorylated Dam1 complex. Diagram on the left indicates phosphorylated proteins. (C) Average microtubule residence time of Ndc80-GFP complex with lethal mutation in region ANdc80p, BNdc80p, or CNdc80p in the presence of selectively phosphorylated Dam1 complex. Diagrams on the left indicate phosphorylated protein (P) and Ndc80p region with a lethal mutation (). On the right are representative kymographs for each experiment. Bars represent average residence time ± error of the mean (estimated by bootstrapping analysis; see Materials and methods or additional details). Ndc80-GFP complex microtubule residence time raw data are included in Figure 2—source data 1. Refer to Supplementary file 1C for statistical analysis.

DOI: http://dx.doi.org/10.7554/eLife.21069.010

Figure 2—source data 1. Table of Ndc80-GFP microtubule residence times for Figure 2.
elife-21069-fig2-data1.xlsx (136.9KB, xlsx)
DOI: 10.7554/eLife.21069.011

Figure 2.

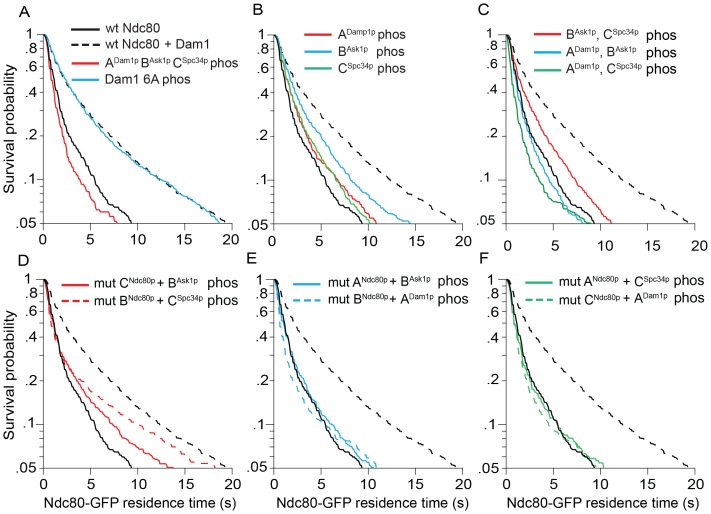
Figure 2—figure supplement 1. Microtubule residence time survival probability plots of experiments in Figure 2.

Figure 2—figure supplement 1.

For all graphs, solid and dashed black lines represent curves for wild-type Ndc80 complex in the absence and presence of wild-type Dam1 complex, respectively. (A–C) Wild-type Ndc80-GFP complex microtubule residence time in the presence of variably phosphorylated Dam1 complex. Dam1 6A phos: all Dam1 complex phosphorylation sites mutated to Ala and treated with Aurora B kinase. (D–F) Microtubule residence time of Ndc80-GFP complex with a lethal mutation in region ANdc80p, BNdc80p, or CNdc80p in the presence of variably phosphorylated Dam1 complex. Data here have a range of n = 485 to 2051.
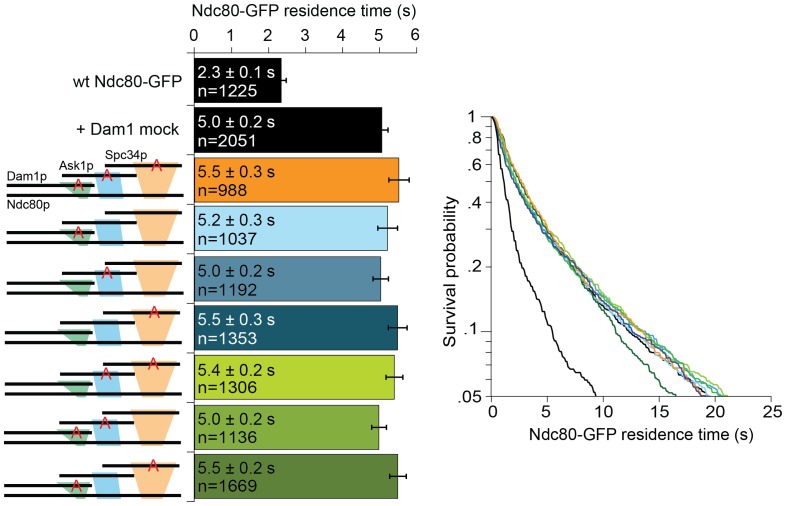
Figure 2—figure supplement 2. Mutating Dam1 complex Aurora B kinase phosphorylation sites to Ala does not affect the interaction between Dam1 and Ndc80 complexes.

Figure 2—figure supplement 2.

Average microtubule residence time of wild-type Ndc80-GFP complex in the presence of mock treated phosphorylation-blocking Dam1 complex mutant constructs. A red ‘A’ identifies the phosphorylation sites that are mutated to alanine. Mock treatment was carried out by substituting ATP with H20. Survival probability plots of the average microtubule residence time shown on the right. Ndc80-GFP complex microtubule residence time raw data are included in Figure 2—figure supplement 2—source data 1. Refer to Supplementary file 1D for statistical analysis.
Figure 2—figure supplement 2—source data 1. Table of Ndc80-GFP microtubule residence times for Figure 2—figure supplement 2.
DOI: 10.7554/eLife.21069.014