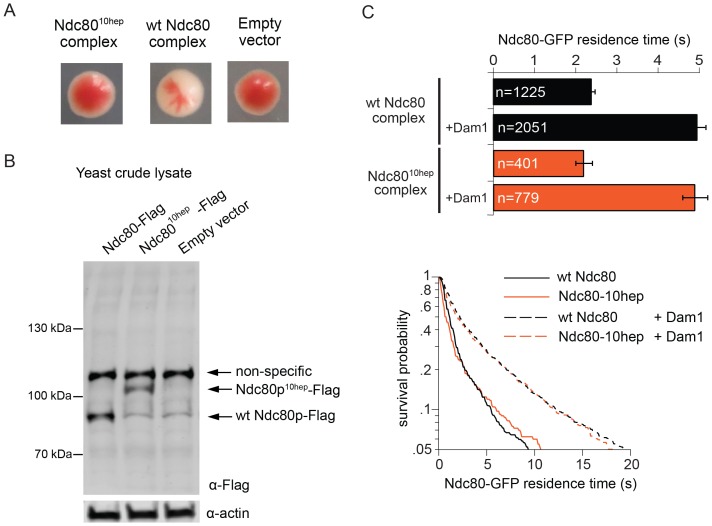
Figure 4. The Ndc8010hep complex does not support growth.
(A) Red/white plasmid shuffle assay to test the viability of the Ndc8010hep complex. Solid red colonies indicate the inability of the Ndc8010hep complex and empty vector to support growth. Sectoring white colony indicates the ability of the wild-type Ndc80 complex to support growth. (B) α-FLAG immunoblot of crude lysate of cells expressing either wild-type Ndc80p, Ndc80p10hep, or empty vector. α-actin immunoblot of the same lysates shows equal loading of the lysates. (C) Wild-type or Ndc8010hep complex average residence time (top) on microtubules in the absence and presence of Dam1 complex as derived from the survival probability curves (bottom). Bars represent average residence time ± error of the mean (estimated by bootstrapping analysis; see Materials and methods or additional details). Ndc80-GFP complex microtubule residence times raw data are included in Figure 4—source data 1. Refer to Supplementary file 1F for statistical analysis of data.
DOI: http://dx.doi.org/10.7554/eLife.21069.020

