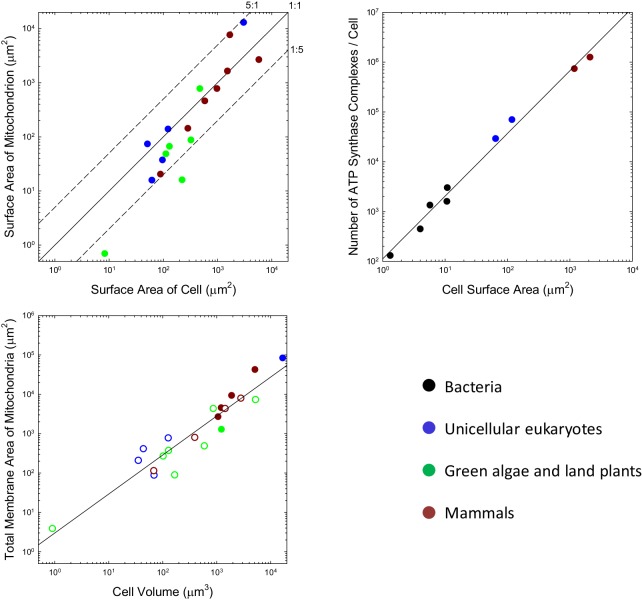
Figure 1. Scaling features of membrane properties with cell size.
(a) Relationship between the total outer surface area of mitochondria and that of the plasma membrane for all species with available data. Diagonal lines denote three idealized ratios of the two. (b) The number of ATP synthase complexes per cell scales with cell surface area (S, in μm2) as (). (c) Relationship between the total (inner + outer) surface area of mitochondria and cell volume for all species with available data. Open points are extrapolations for species with only outer membrane measures, derived by assuming an inner:outer ratio of 4.6, the average of observations in other species. References to individual data points are provided in Appendix 1–tables 1 and 2.

