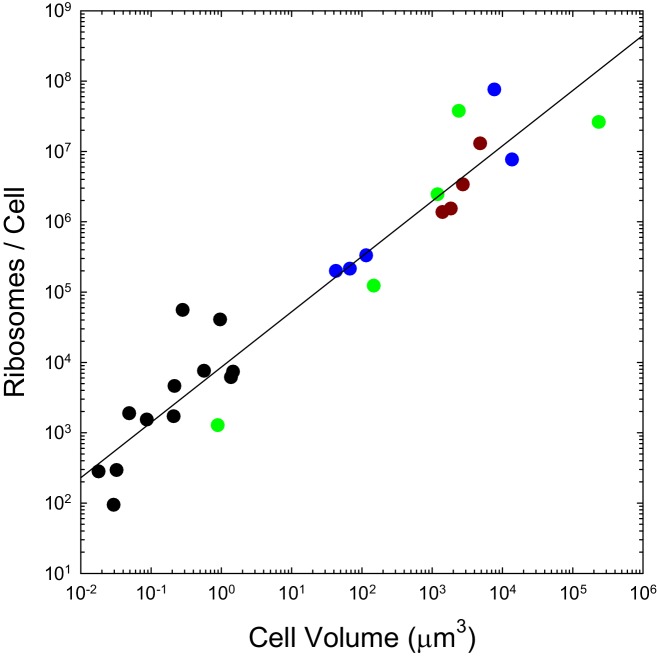
Figure 2. The number of ribosomes per cell scales with cell volume (V, in μm3) as 7586V0.82 (r2 = 0.92; SEs of the intercept and slope on the log scale are 0.13 and 0.05, respectively).
Color coding as in previous figures. The data presented in this figure can be found in Figure 2—source data 1; see also Appendix 1–table 3.

