Figure 6.
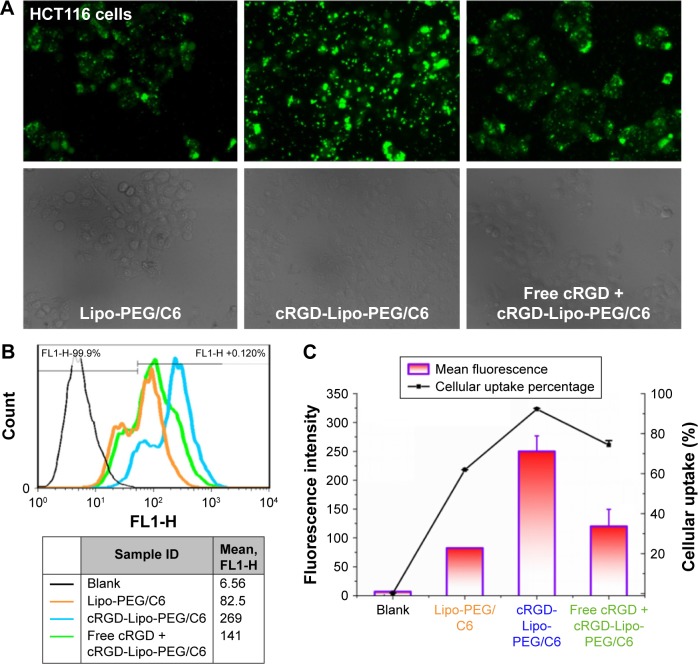
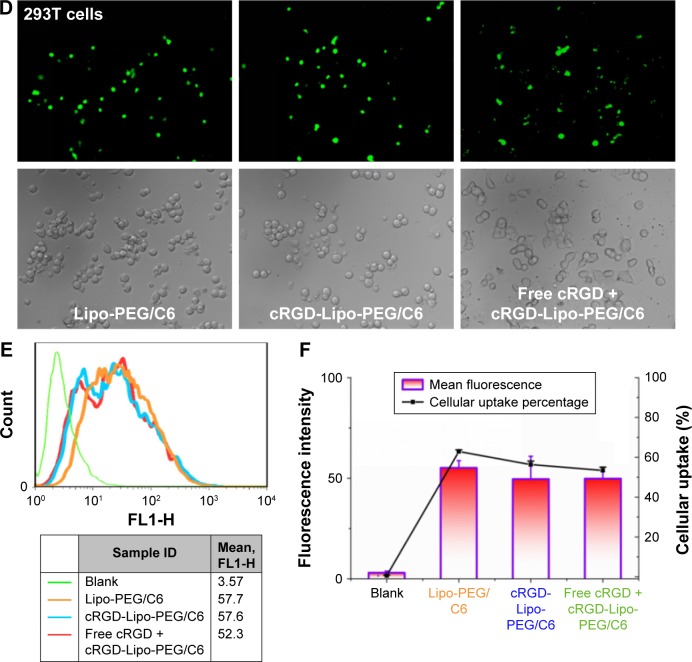
Fluorescence and flow cytometry experiments in HCT116 cells.
Notes: (A) Fluorescence microscope images showing the cellular uptake in HCT116 cells. Magnification ×20. (B) Flow cytometry charts showing the cellular uptake in HCT116 cells. (C) Mean fluorescence intensity and cellular uptake percentage as determined by flow cytometry experiments. (D) Fluorescence microscope images showing the cellular uptake in 293T cells. Magnification ×20. (E) Flow cytometry charts showing the cellular uptake in 293T cells. (F) Mean fluorescence intensity and cellular uptake percentage as determined by flow cytometry experiments.
Abbreviations: cRGD, cyclic arginylglycylaspartic acid; PEG, polyethylene glycol; Lipo, liposomes; C6, coumarin 6.


