
Figure 3.
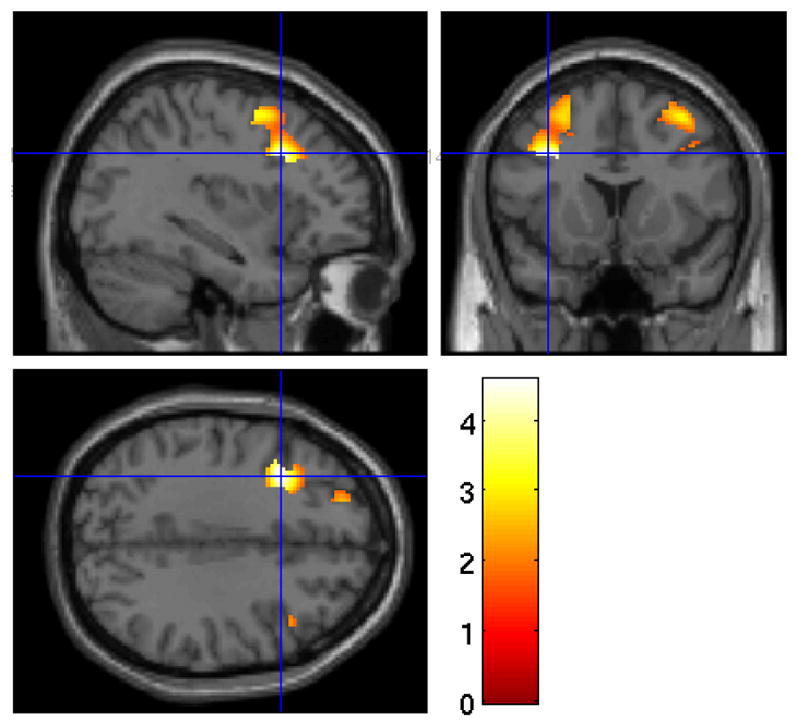
Heat map of t values for the association between rSWA and DLPFC rCMRglu. Crosshairs indicate peak voxel on a canonical single subject T1 image. Greater DLPFC metabolism was associated with greater rSWA.
Official websites use .gov
A
.gov website belongs to an official
government organization in the United States.
Secure .gov websites use HTTPS
A lock (
) or https:// means you've safely
connected to the .gov website. Share sensitive
information only on official, secure websites.
Heat map of t values for the association between rSWA and DLPFC rCMRglu. Crosshairs indicate peak voxel on a canonical single subject T1 image. Greater DLPFC metabolism was associated with greater rSWA.