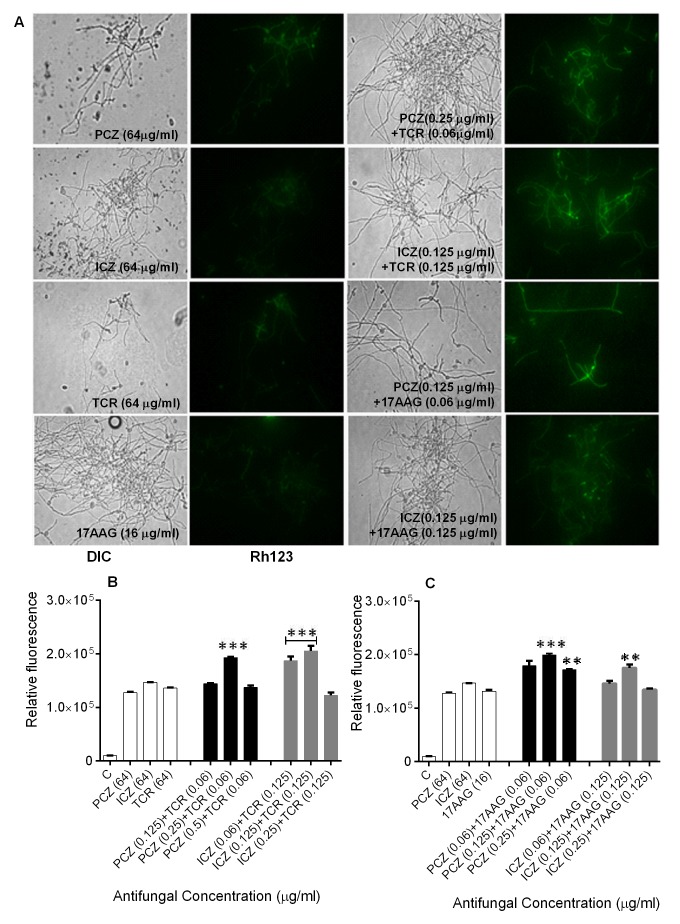
Figure 3. FIGURE 3: Changes in ΔΨm in S. prolificans isolate 1 germlings triggered by treatment with PCZ or ICZ combined with TCR or 17AAG.
(A) Fluorescence images of S. prolificans germlings stained with Rh-123.
(B, C) Relative fluorescence levels in S. prolificans germlings treated with PCZ or ICZ plus TCR (B) and PCZ or ICZ plus 17AAG (C). **p<0.001; ***p<0.0001. Error bars on graphs indicate standard deviation. DIC, differential interference contrast.

