
Figure 3. Growth of HL60/TβRII and HL60/TβRII-B cells in BALB/c nude mice 22 days post-inoculation.
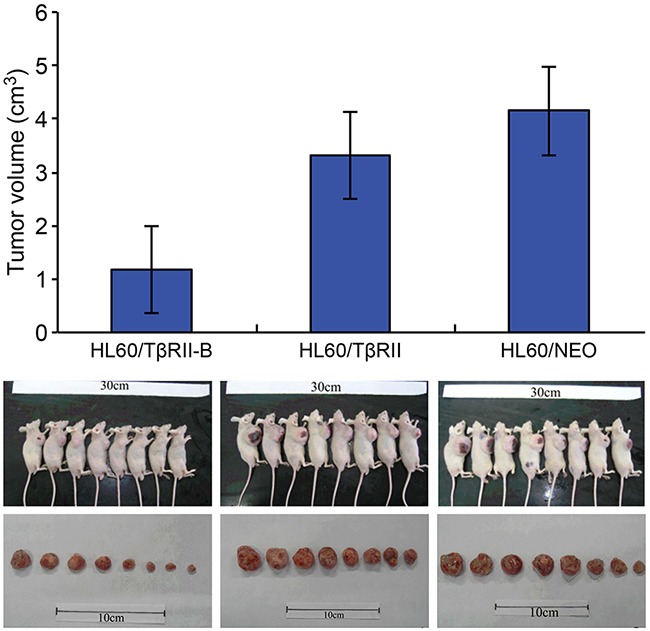
The data are representative of two individual experiments. Each group contained eight mice. Representative images are shown. The data are expressed as the mean ± SEM. **P < 0.01, *P < 0.05, two-tailed Student's t-test.