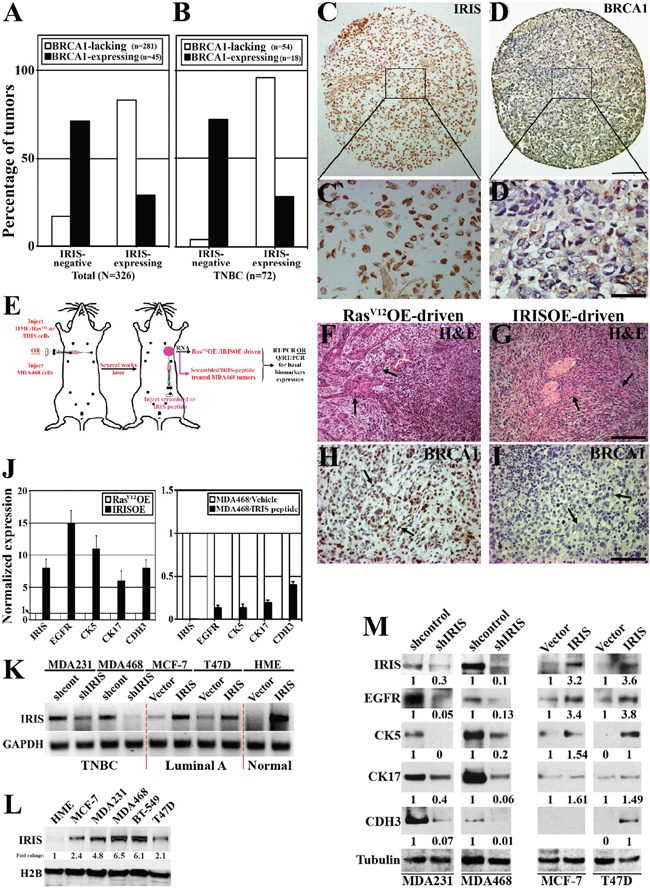
Figure 1. IRISOE suppresses BRCA1 expression and enhances basal-biomarkers expression in breast cancer cells.

Immunohistochemical analysis of IRIS and BRCA1 expression in a cohort of breast tumor (all subtypes, n=326, A), or a sub-cohort of TNBC tumors (n=72, B). Representative images of IRISOE (C, and larger magnification C`) associated with lack of BRCA1 expression (D, and larger magnification D`) in a TNBC tumor sample. Scale bars: 300μm in C and D, and 50μm in C` and D`. E. Schematic of the strategy used to generate RasV12OE-/IRISOE-driven or MDA468 + scrambled/MDA468 + IRIS inhibitory peptide orthotopic mammary tumors in SCID/Nu/Nu mice, followed by tumor and RNA isolation and basal-biomarkers expression analysis. H&E (F and G) and BRCA1 (H and I) staining on RasV12-driven or IRISOE-driven orthotopic mammary tumors, respectively generated as in (E). Scale bars: 200μm in F and G, and 100μm in H and I. J. real-time QRT/PCR analysis for the expression of IRIS and several basal-biomarkers mRNA in RasV12OE-driven or IRISOE-driven orthotopic mammary tumors (left), and MDA468 orthotopic mammary tumors after treatment with scrambled- or IRIS-inhibitory peptide (right). K. RT/PCR analysis of IRIS mRNA in naïve HME or the luminal cell lines; MCF7 and T47D before and after IRISOE and the TNBC cell lines; MDA231 and MDA468 before and after IRIS knockdown. L. Comparison of IRIS protein expression in the luminal A cell lines; MCF7, T47D, and the TNBC cell lines; MDA231, MDA468 and BT-549 compared to naïve HME cells. M. Western blot analysis for the expression of several basal-biomarkers in the TNBC cell lines; MDA231 and MDA468 before and after IRIS-silencing, and the luminal cell lines; MCF7 and T47D before and after IRISOE.
