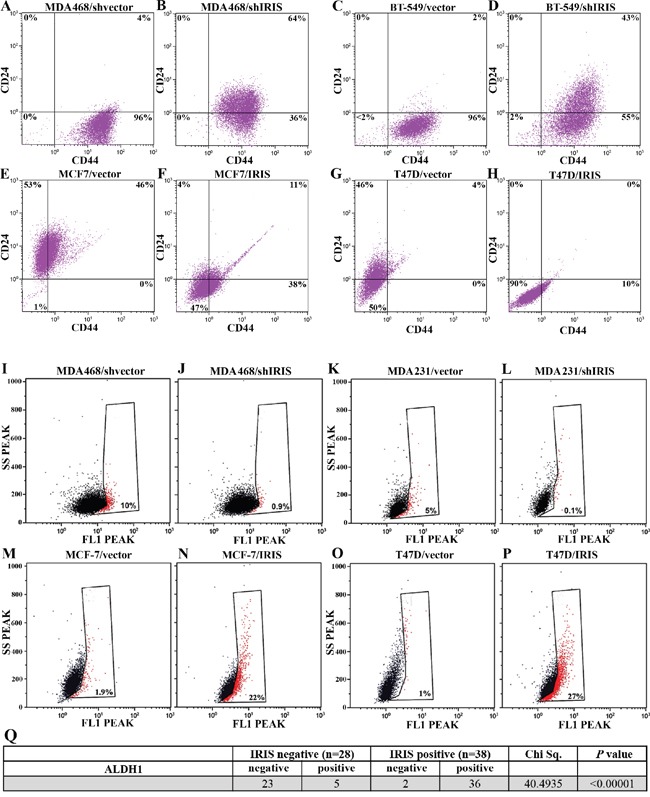
Figure 3. IRISOE drives the TIC phenotype.

FACS analysis for surface CD44 and CD24 double-staining (for 1h) populations within shcontrol- A., or shIRIS- B. expressing MDA468 cells, shcontrol- C., or shIRIS- D. expressing BT-549 cells, vector E., or IRIS- F. overexpressing MCF7, vector- G., or IRIS- H. overexpressing T47D cells. FACS analysis showing ALDH1+ (red) compared to ALDHA- (black) populations in shcontrol- I., or shIRIS- J. expressing MDA468 cells, shcontrol- K., or shIRIS- L. expressing MDA231 cells, vector M., or IRIS- N. overexpressing MCF7, vector- O., or IRIS- P. overexpressing T47D cells. Q. Association analysis of IRIS and the expression of ALDH1 in a cohort of metastatic breast cancer patients (n=66, from Egyptian NCI) conducted using real-time QRT/PCR.
