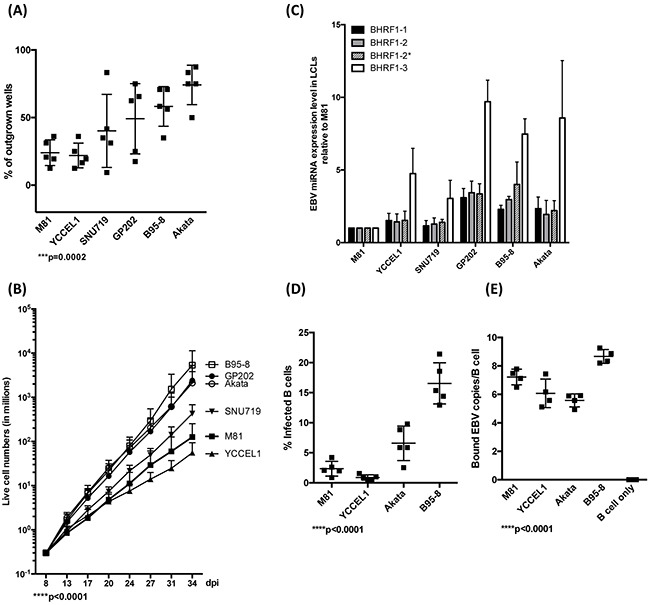
Figure 1. EBV strains transform B cells with variable efficiency.

A. This dot plot shows the efficiency of EBV-mediated transformation in infected primary B cell populations from 5 independent blood samples and seeded at 3 EBNA2-positive cells per well in 96 well cluster plates. The values given represent the percentage of outgrown wells. B. These curves show the increase in trypan blue- negative live cell numbers over time after infection of B cells from 7 independent blood samples with different EBV strains at high cell density. C. The bar graph shows the expression levels of all 4 members of the BHRF1 miRNA cluster in LCLs generated with 3 independent blood samples. D. We determined the efficiency of B cell infection by staining five different blood samples with an EBNA2-specific antibody 3 days after infection with the indicated viruses at the same multiplicities of infection as defined by qPCR. The graph gives the percentage of infected cells. E. The efficiency of B cell binding was assessed by qPCR after exposure of naïve B cells isolated from 5 independent blood samples to the same number of viral genomes. The dot plot shows the number of viruses bound per B cell. The p-values in (A), (B), (D), and (E) give the results of global test analyses by using global mixed linear model analyses with random effect. Error bars represent the mean with s.d.
